St. Pierre Dashboard Field Guide

Every dashboard, how to read it, when to read it, and what to kill.
Audit date: 2026-07-19 · covers all 27 dashboard surfaces across 6 rooms · built for stpierre.ai

1 · Start Here (the wife test)

The bar for this guide: hand it to someone with zero prior contact and they can run every dashboard. So we start from scratch — what a dashboard even is here, the six rooms, and a simple routine for when to open what.

What "a dashboard" means in this company

A dashboard is one web page that answers one question about one part of the business. Most of them read live from "the brain" — a Postgres database (a big spreadsheet-in-the-cloud) that stores everything the business knows.

A good dashboard is glanceable: you look, you learn one thing, you either act or move on. If a page needs a manual or ten minutes of study, it is doing too much. Some pages in the current list are actually documents or one-off reports pretending to be dashboards — a big part of this audit is separating those out.

The six rooms, one sentence each

  • 💸 Finance — Can the business survive long enough to earn its first client cash? (hero: runway)
  • 📣 Marketing — Turn creative volume into qualified leads at the lowest possible cost. (hero: CPQL)
  • 📞 Sales — Move every real opportunity to the right: lead → booked call → paid client. (hero: RPL / cash collected)
  • 📦 Fulfillment — Once a client pays, are we delivering the guarantee so they stay and renew? (hero: clients on guarantee pace)
  • 🏗️ Projects — Are we building the machine, and can we keep the lights on while we build it? (hero: runway)
  • 🔁 Loop Engine — Run the week as a loop: pick the targets, do the work, grade against them, adjust. (hero: weekly hit-rate)

Your routine — when to open what

If you only did this, you'd be running the business correctly. Daily surfaces are a five-minute morning loop. Weekly ones are a Sunday/Monday review. On-trigger ones you open only when a specific thing happens.

CadenceOpen thisWhenQuestion it answers30-second read
DailyCockpit (Projects)Morning, first thing (before 10:30 huddle)What needs my attention today?Read "Do now" (top 3) and the runway tile. Pick the top money block.
DailyFinance RoomMorning, before 9amHow many days of cash are left?Look at the big margin tile (above/below floor) and days-to-$0. Work the P0 cash-in tasks.
DailyMarketing Room hubMorningWhat's the state of the ad machine?Glance the four tiles. Then open Ads Autopilot.
DailyAds AutopilotMorning, after the hubWhat did the ad engine decide overnight?Read the verdict row (Promote/Kill counts). Protect any pack with a real lead.
DailySales Command CenterMorning + before any call blockWhat's real, and what's the one move?Read the black tile (signed+paid) and the top "Do next" card. Any red OVERDUE = priority.
DailyDelivery BoardMorning delivery checkIs any client at risk?Scan the count band, then read only the AT-RISK rows.
DailyReview Panel (Morning Brief)MorningWhere are we vs plan, what's off-track?Read hit-rate + off-track list. Comment on the money row.
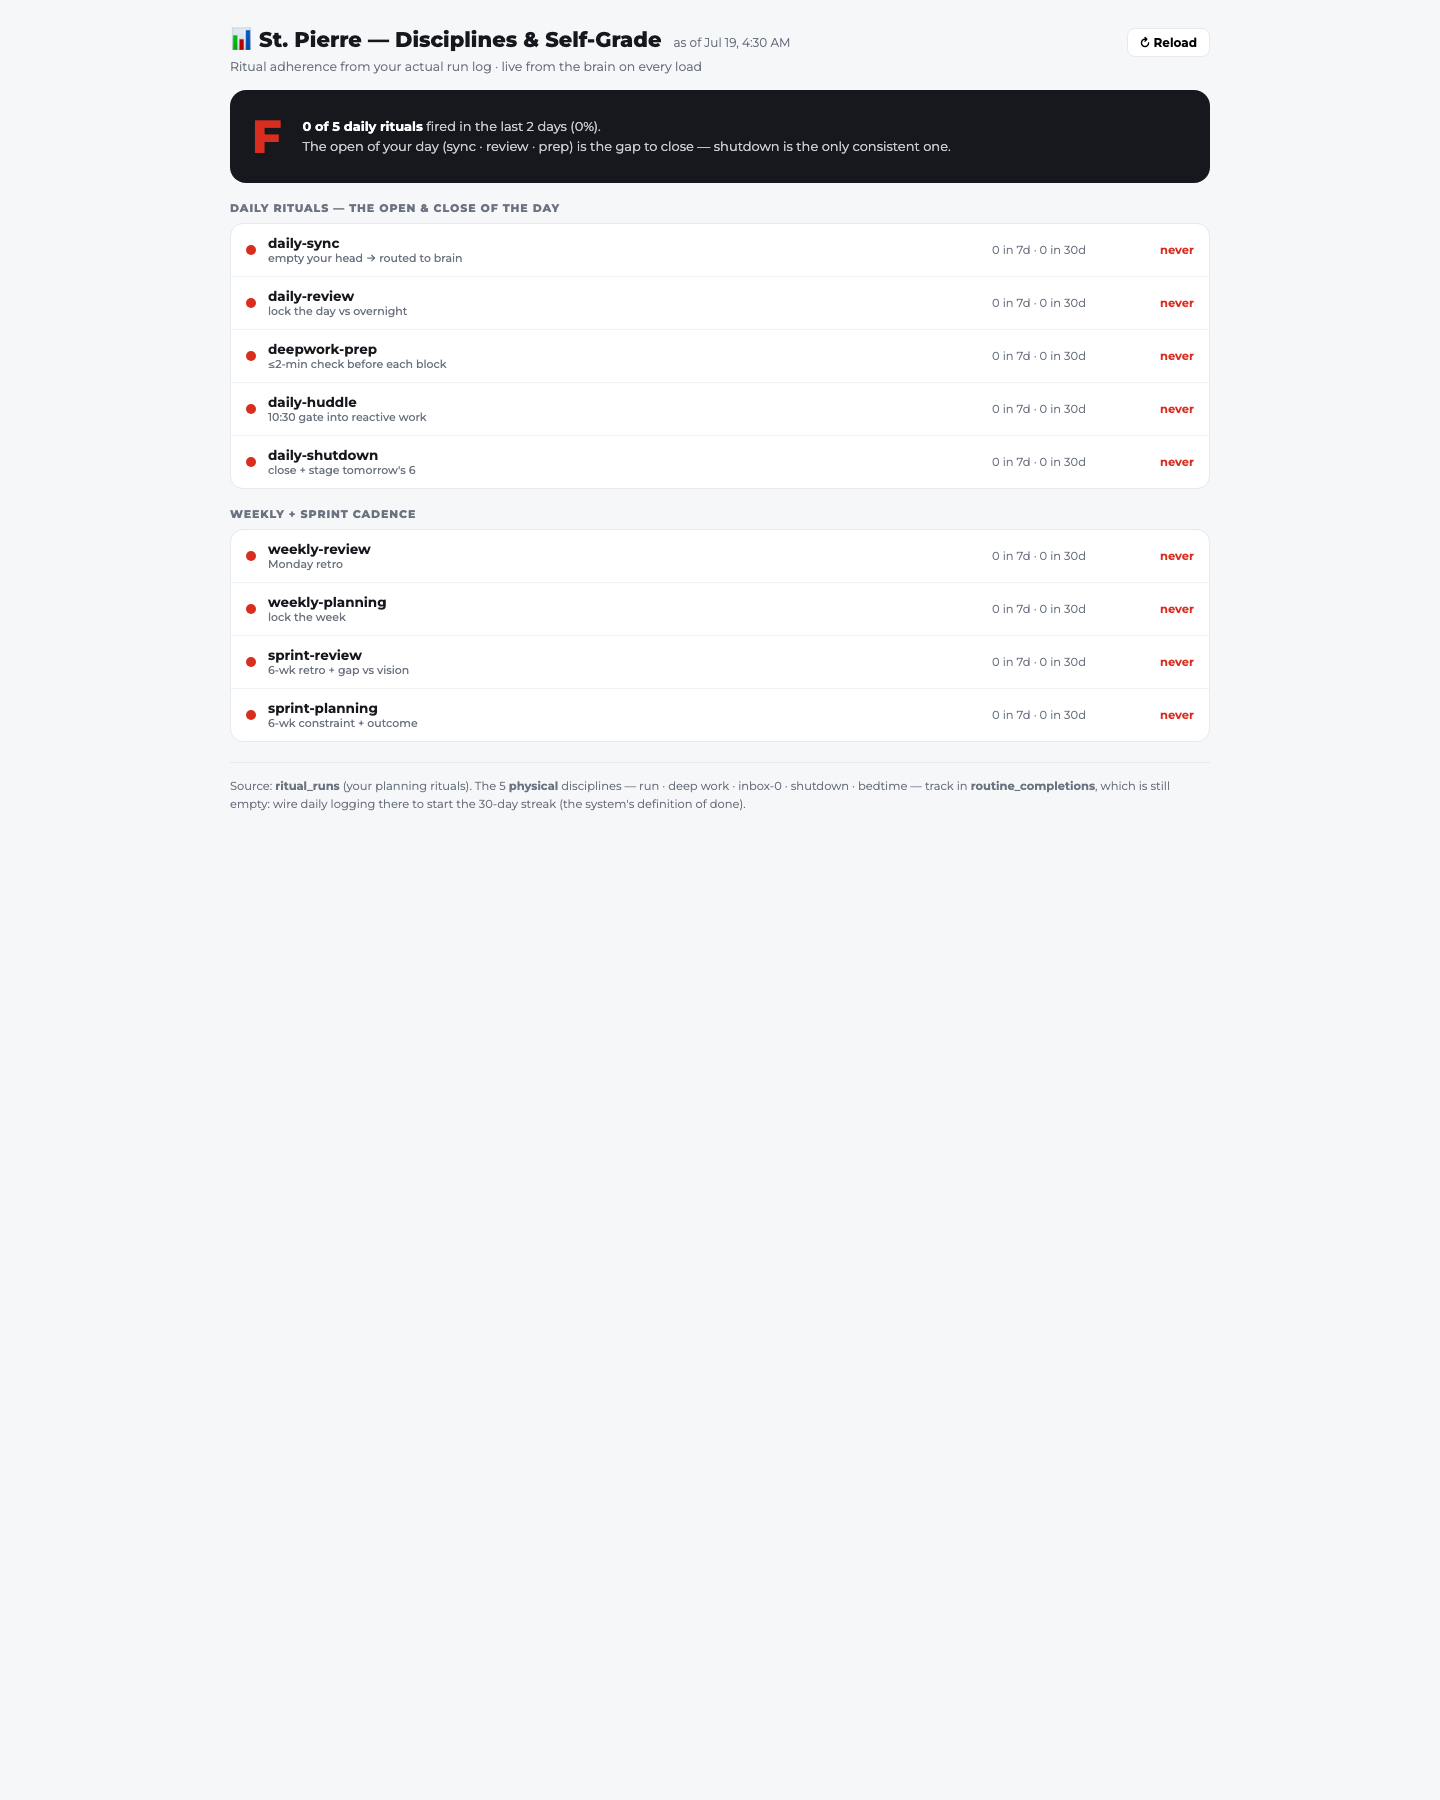
DailyDisciplinesDaily glanceAm I actually running my rituals?Read the letter grade. (Note: logging is currently broken — see Fix List.)
WeeklyCompany ScorecardSunday/MondayFull cash review + pipeline vs burnNet cash, weekly burn, runway weeks; weighted pipeline vs monthly expense.
WeeklyCreative RadarWeekly, planning the next batchWhich angles should we test next?Read the cross-lane pattern gaps (where competitors cluster, you don't).
WeeklySunday Sales BriefSunday/MondayThe one call that moves the numberRead the hero tile + Section 3 ("where your push changes the outcome").
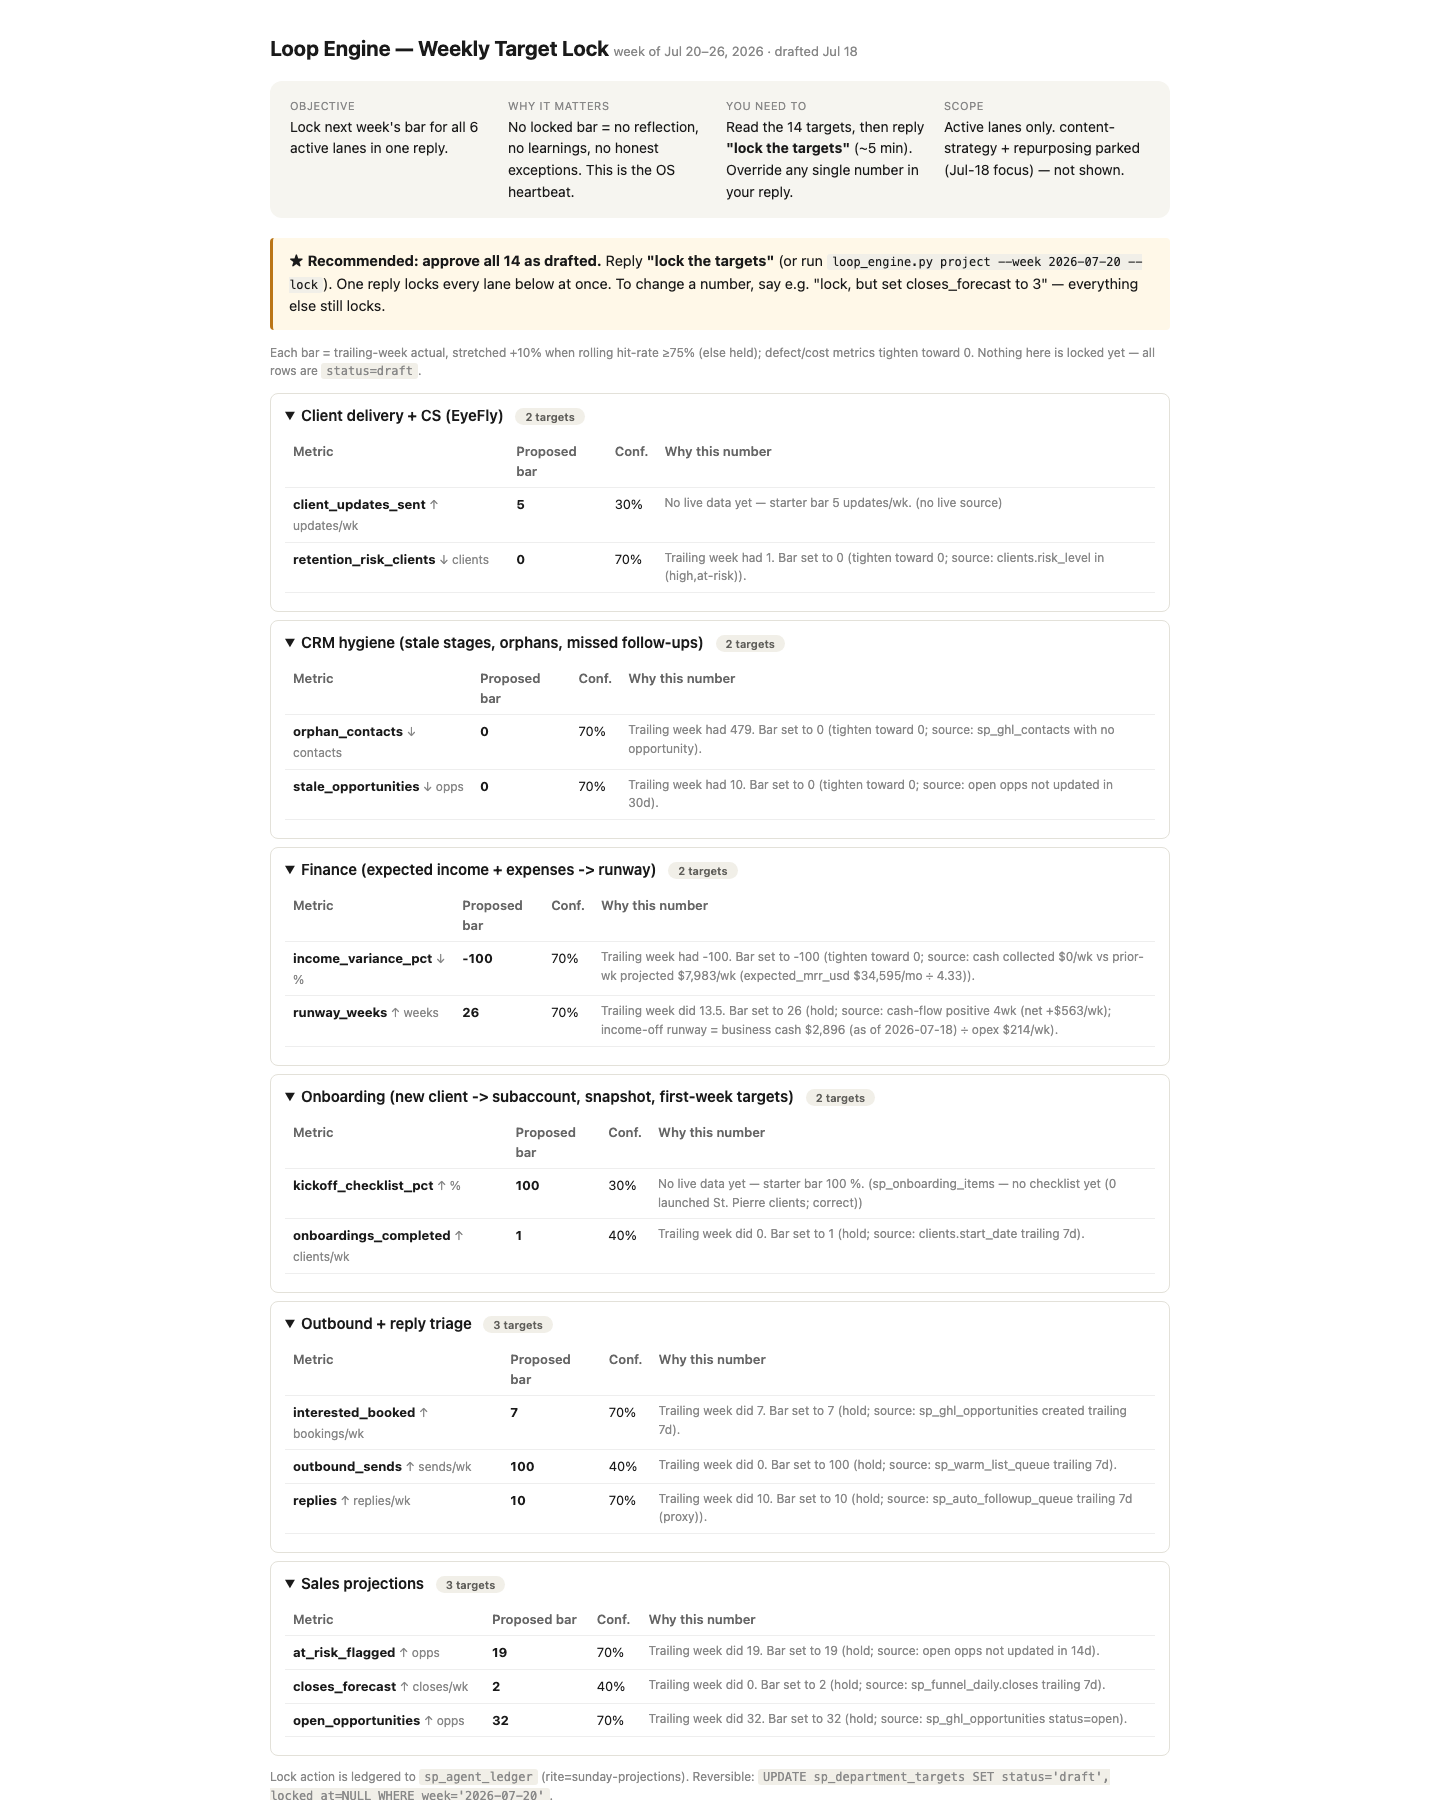
WeeklyReview Panel (Weekly Report) + Target LockSunday/MondayGrade the week, lock next week's targetsRead hit-rate; skim the 14 draft bars; reply "lock the targets."
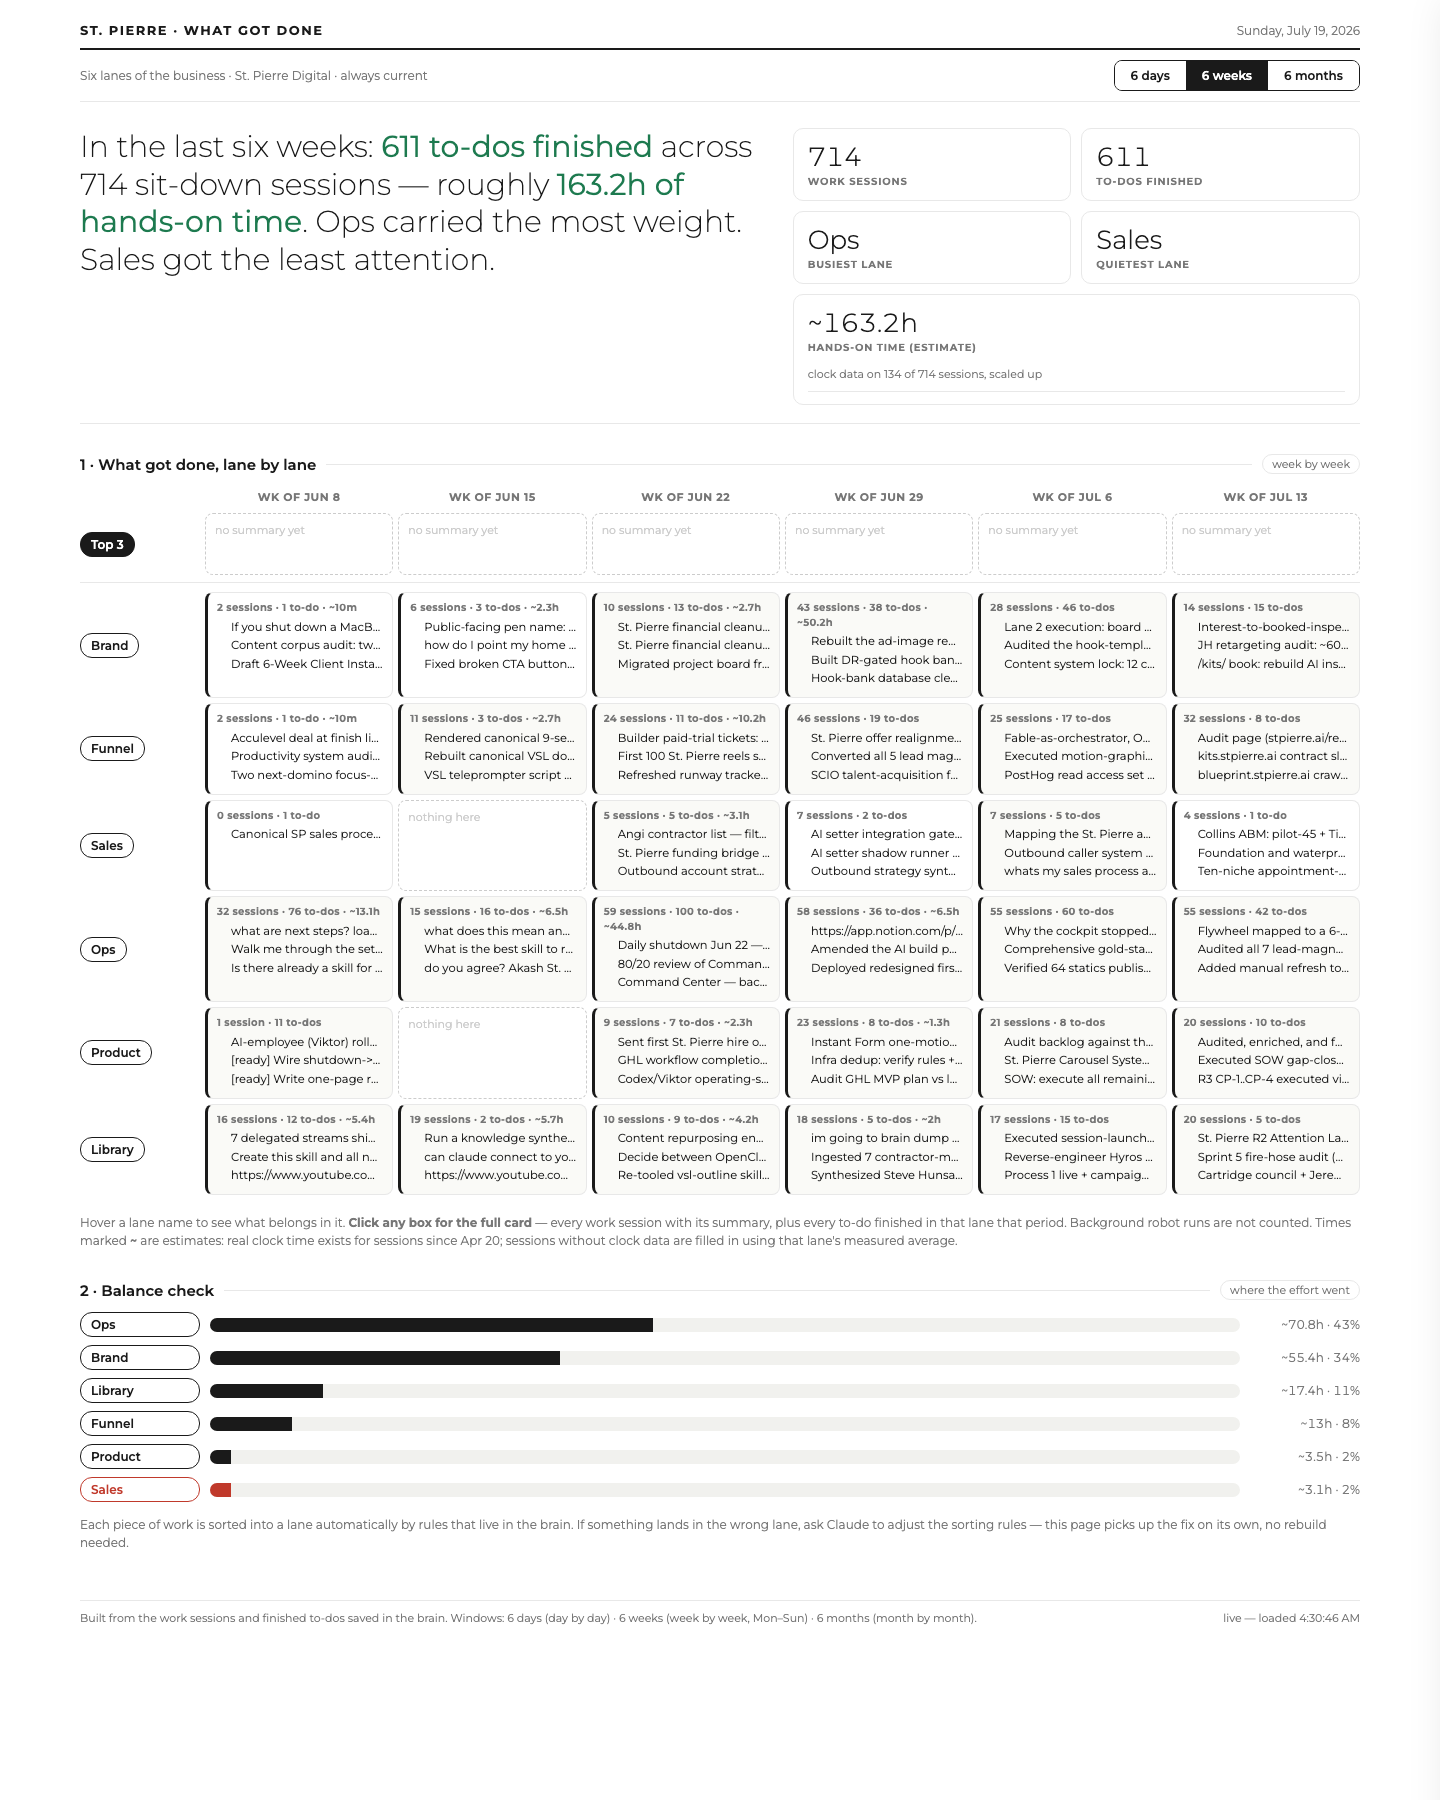
WeeklyAccomplishmentsFriday reflection / SundayWhat actually got done, and where did effort go?Read the balance-check bars — did hours match priorities?
WeeklyNorth Star + PostHogWeekly/monthlyGoal pacing + where leads come fromNorth Star: goal RAG pacing. PostHog: first vs last-touch source mix.
On-triggerConsolidated P&LMonthly, or "where did money go?"Spend by category and monthRead the category rows; redder cell = more spend that month.
On-triggerProfit First P&LModeling a pricing/growth decisionHow many months to $5K take-home?Drag a lever, watch the milestone tiles. It's a model, not reality.
On-triggerAttribution TimelineInvestigating one specific leadHow did this one person find and move through us?Click a lead on the left; read their stitched timeline on the right.
On-triggerAds Pipeline BoardWhen you suspect inventory is stuckHow many ads are stuck, and how old?Read the stage tiles. (Everything's parked by design right now.)
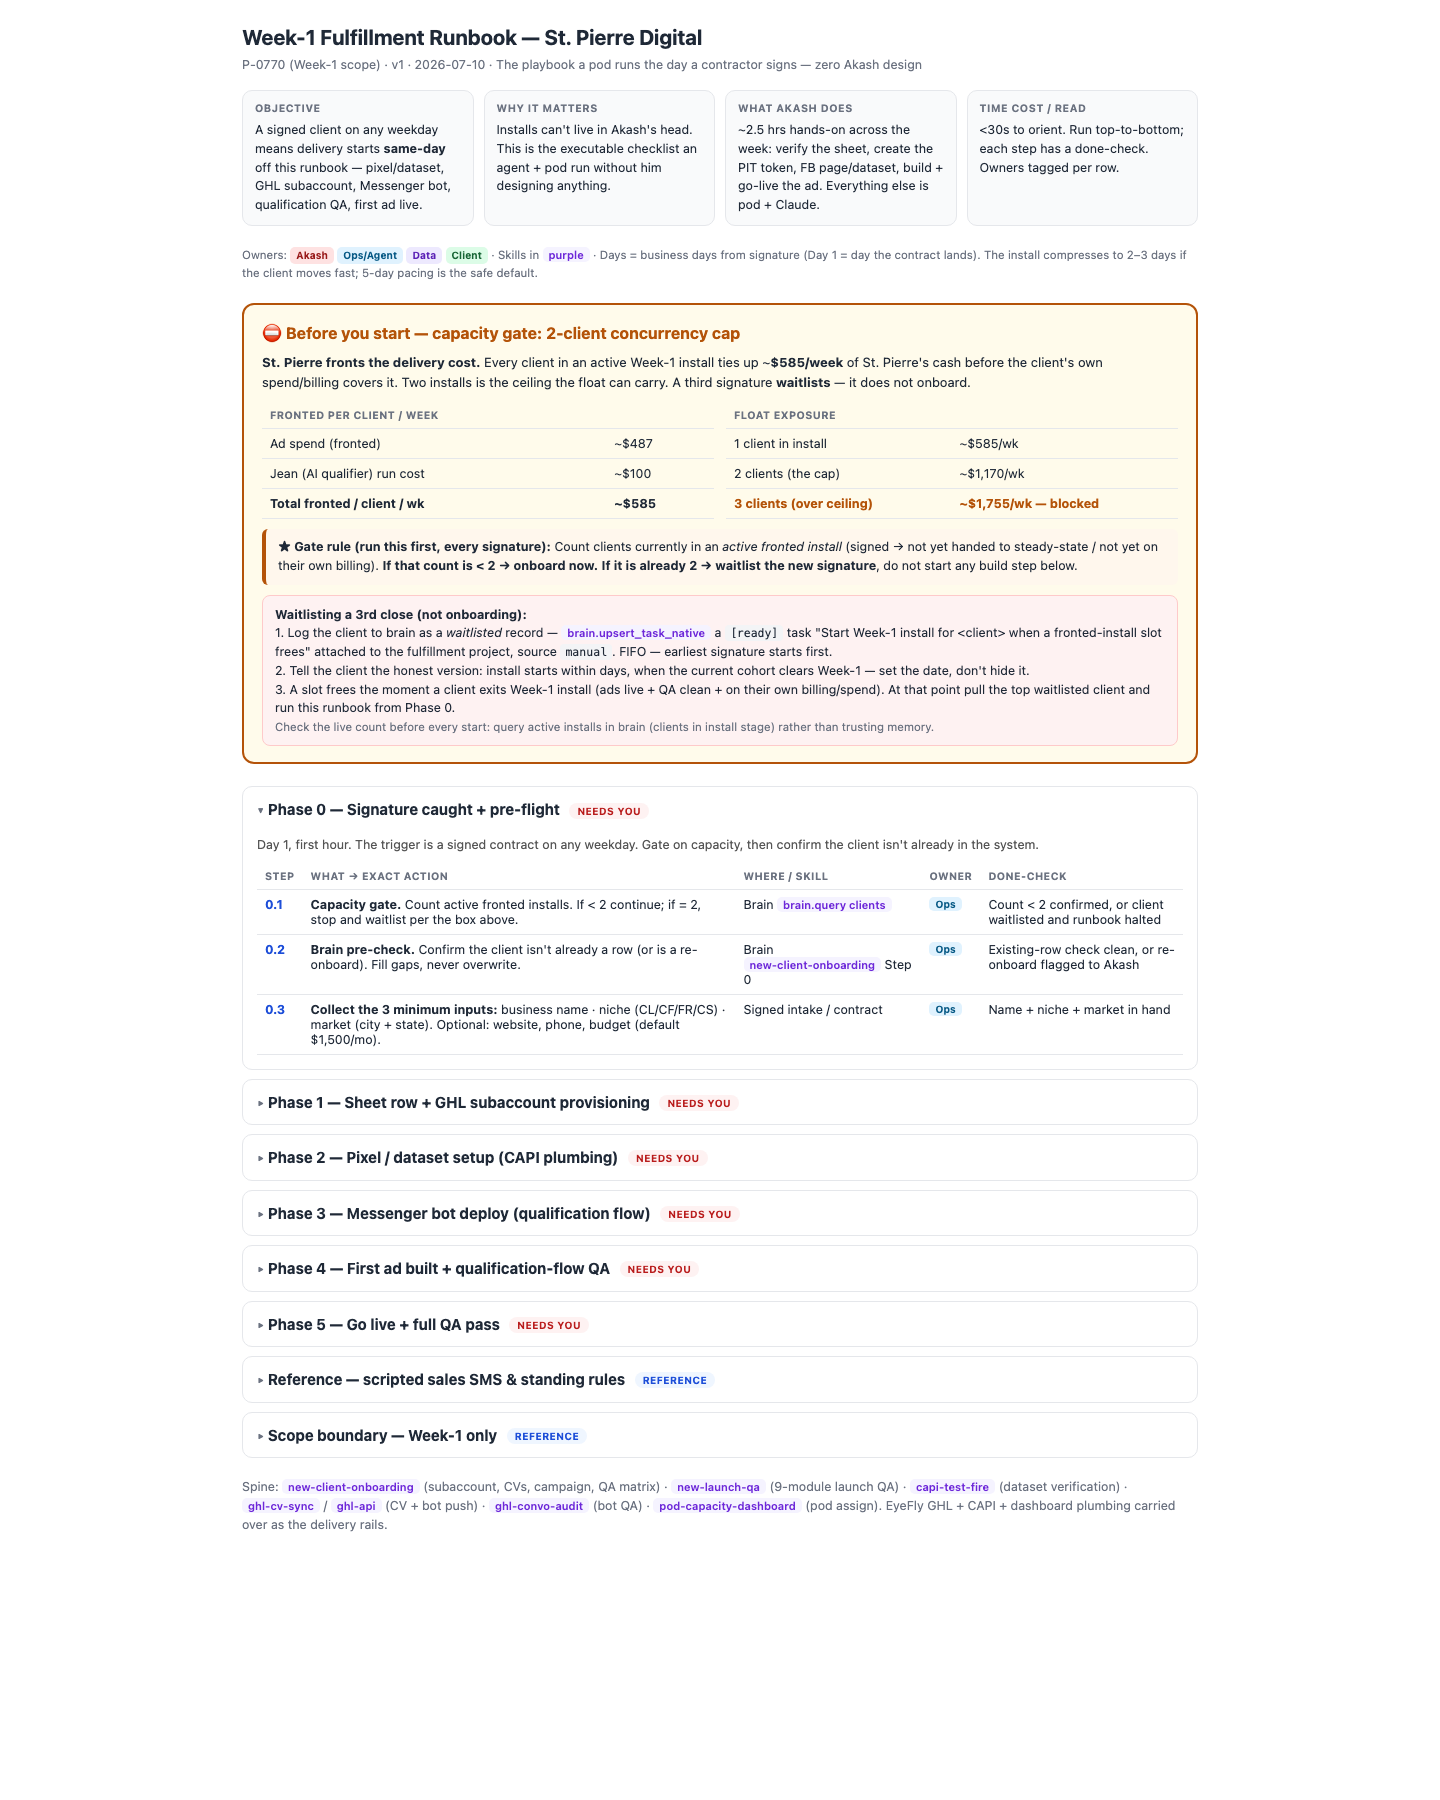
On-triggerInstall SOP / Week-1 RunbookWhen a new client signsHow do we onboard this signup?Run the capacity gate, then work the phases. (These are playbooks, not dashboards.)
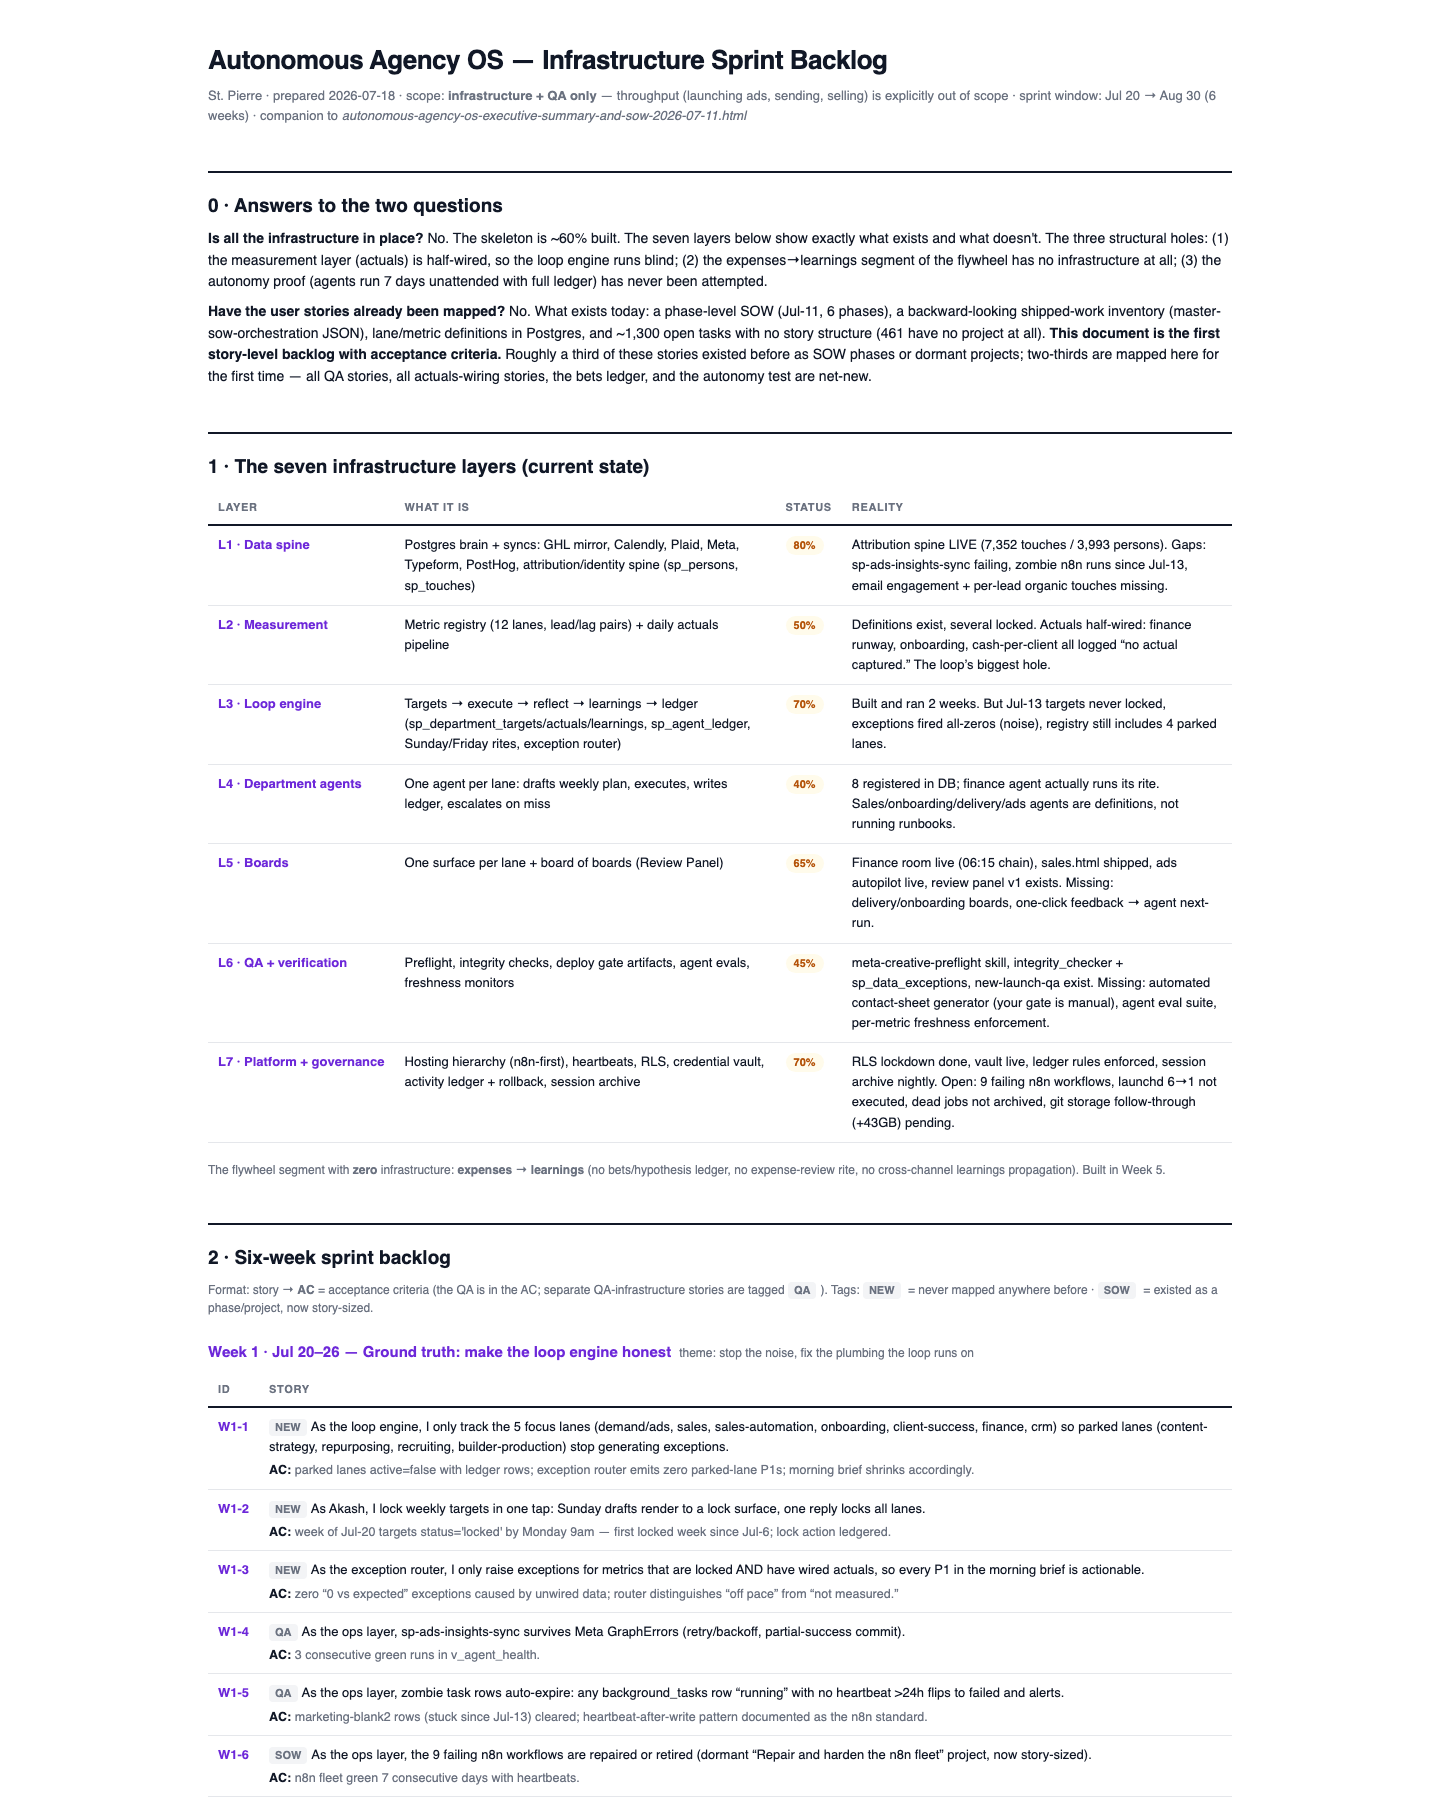
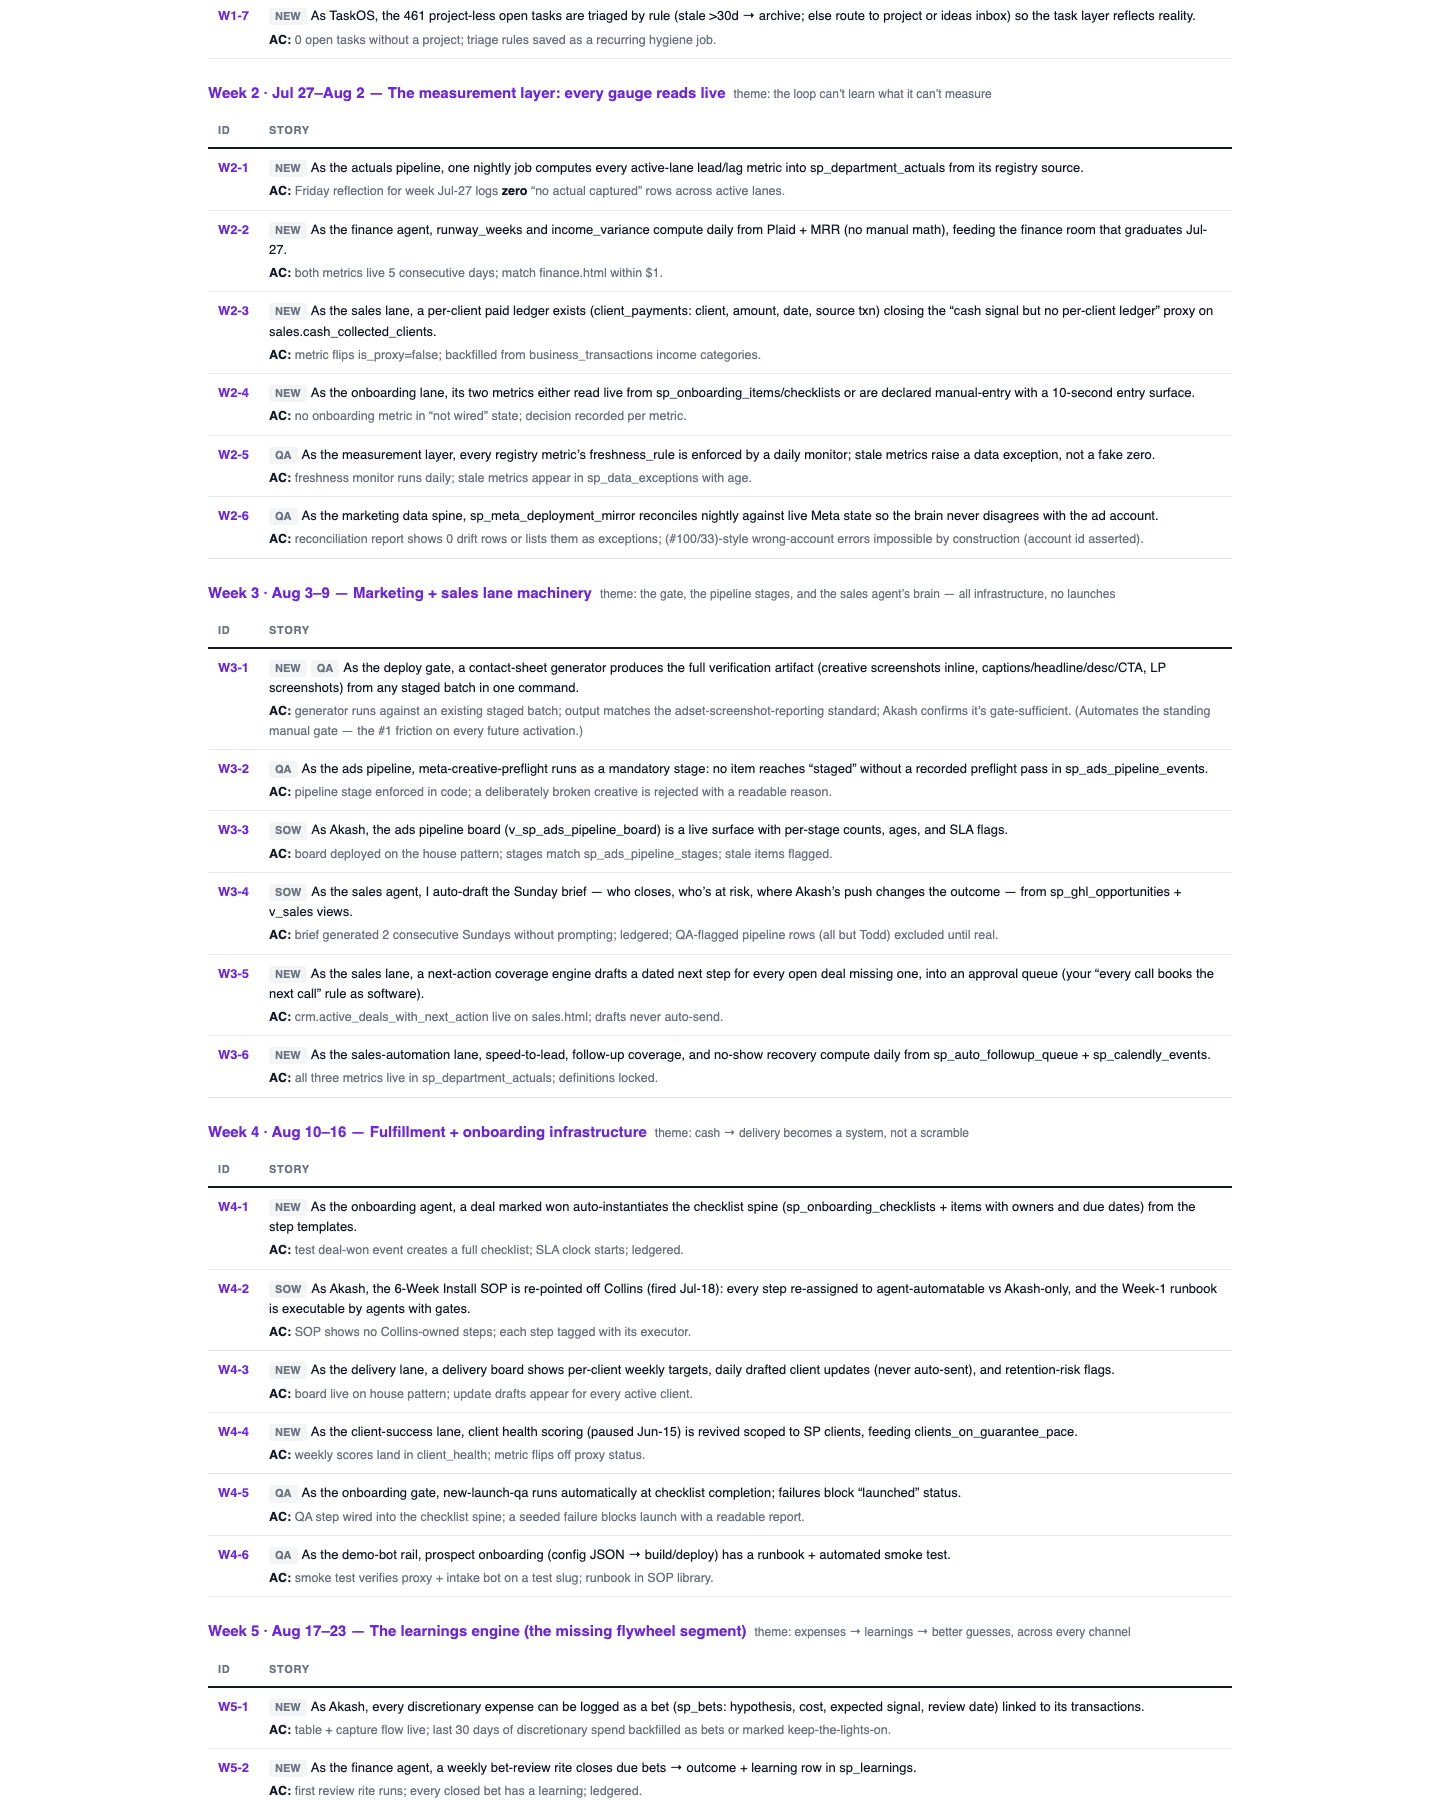
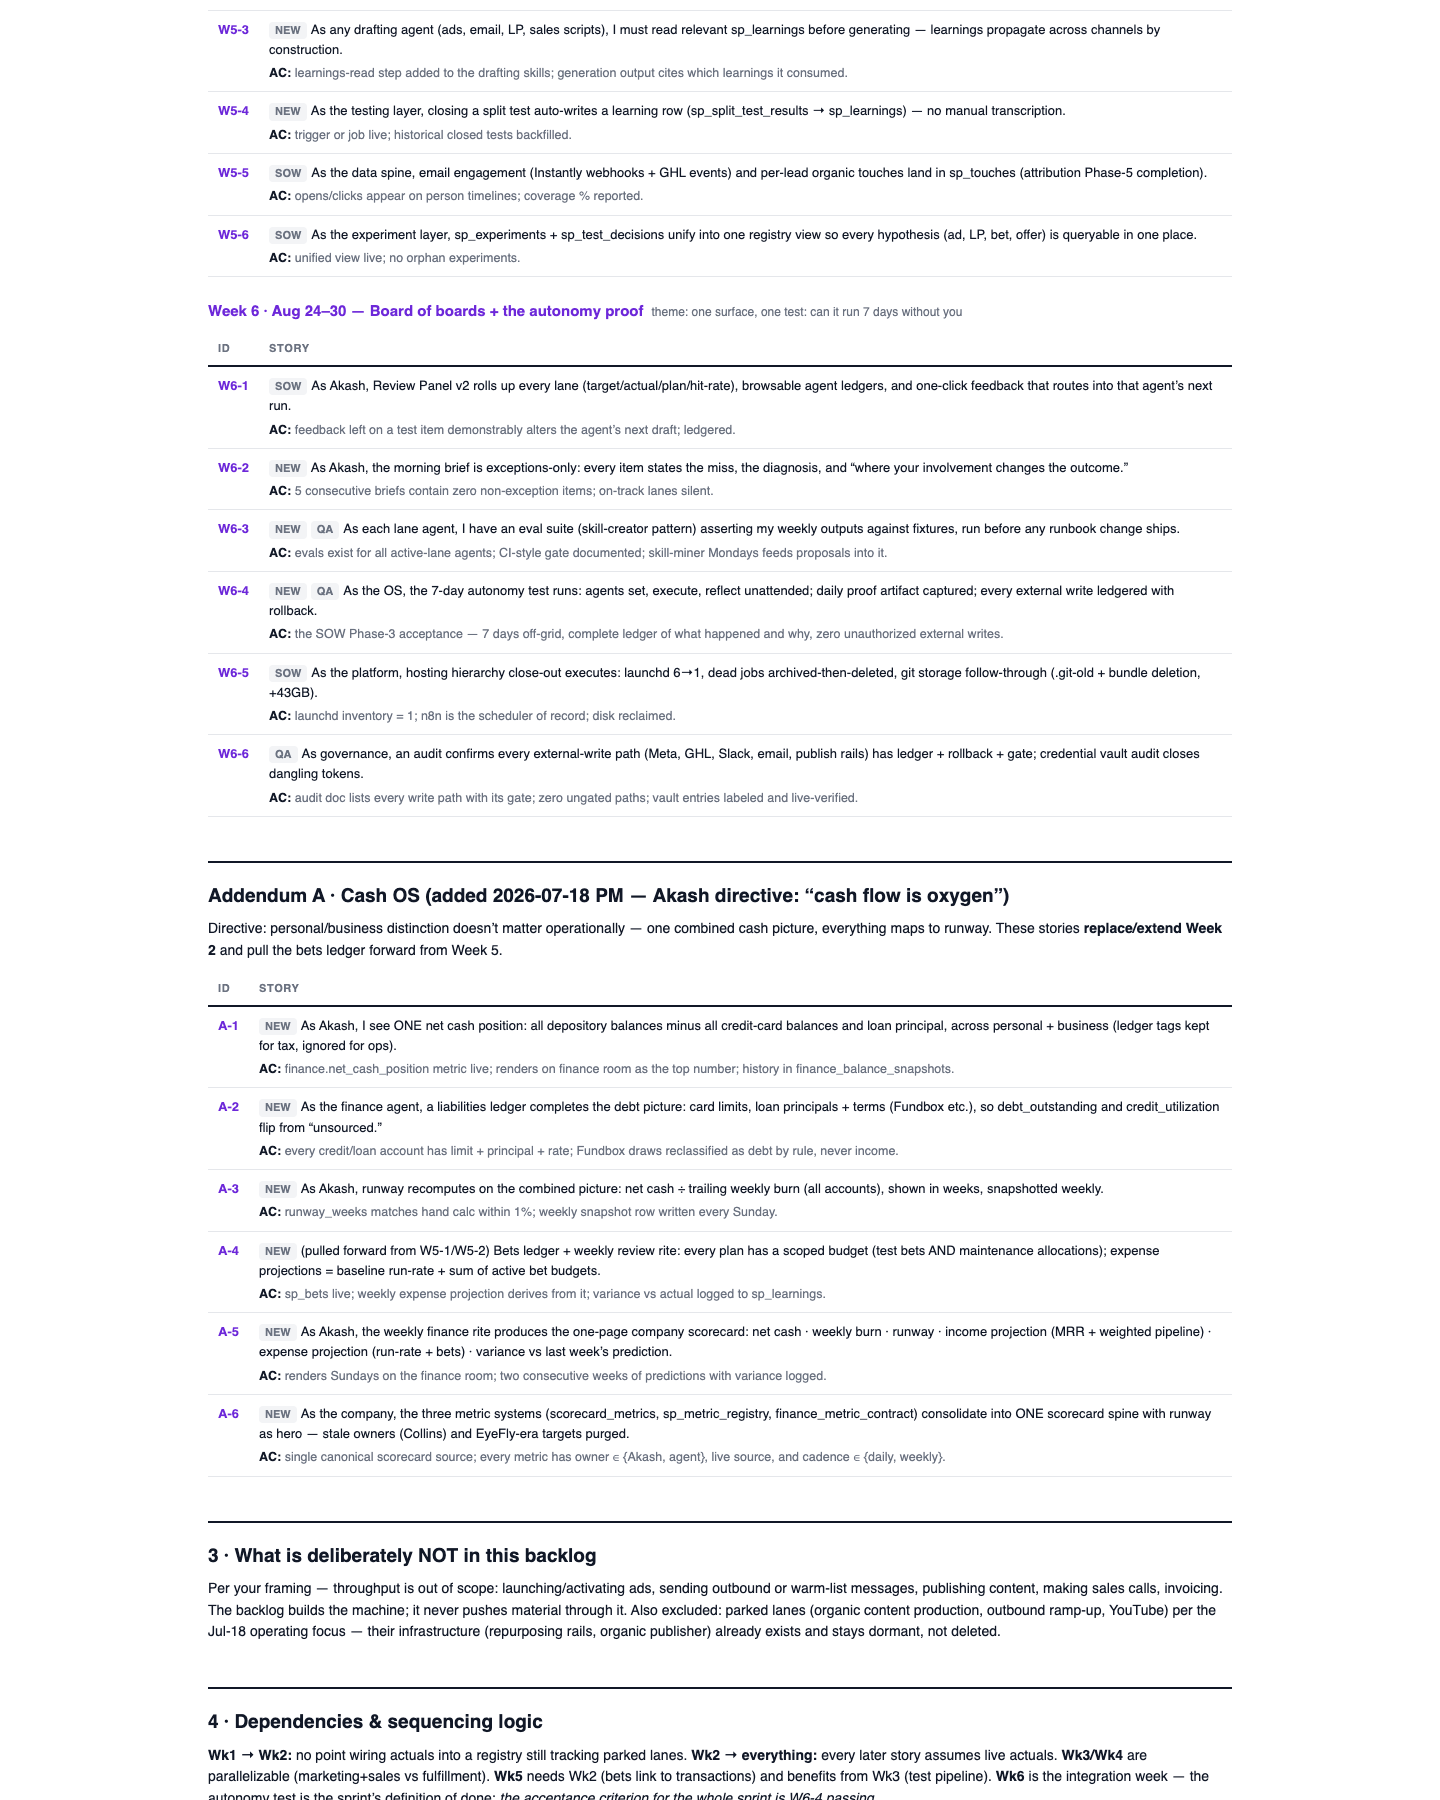
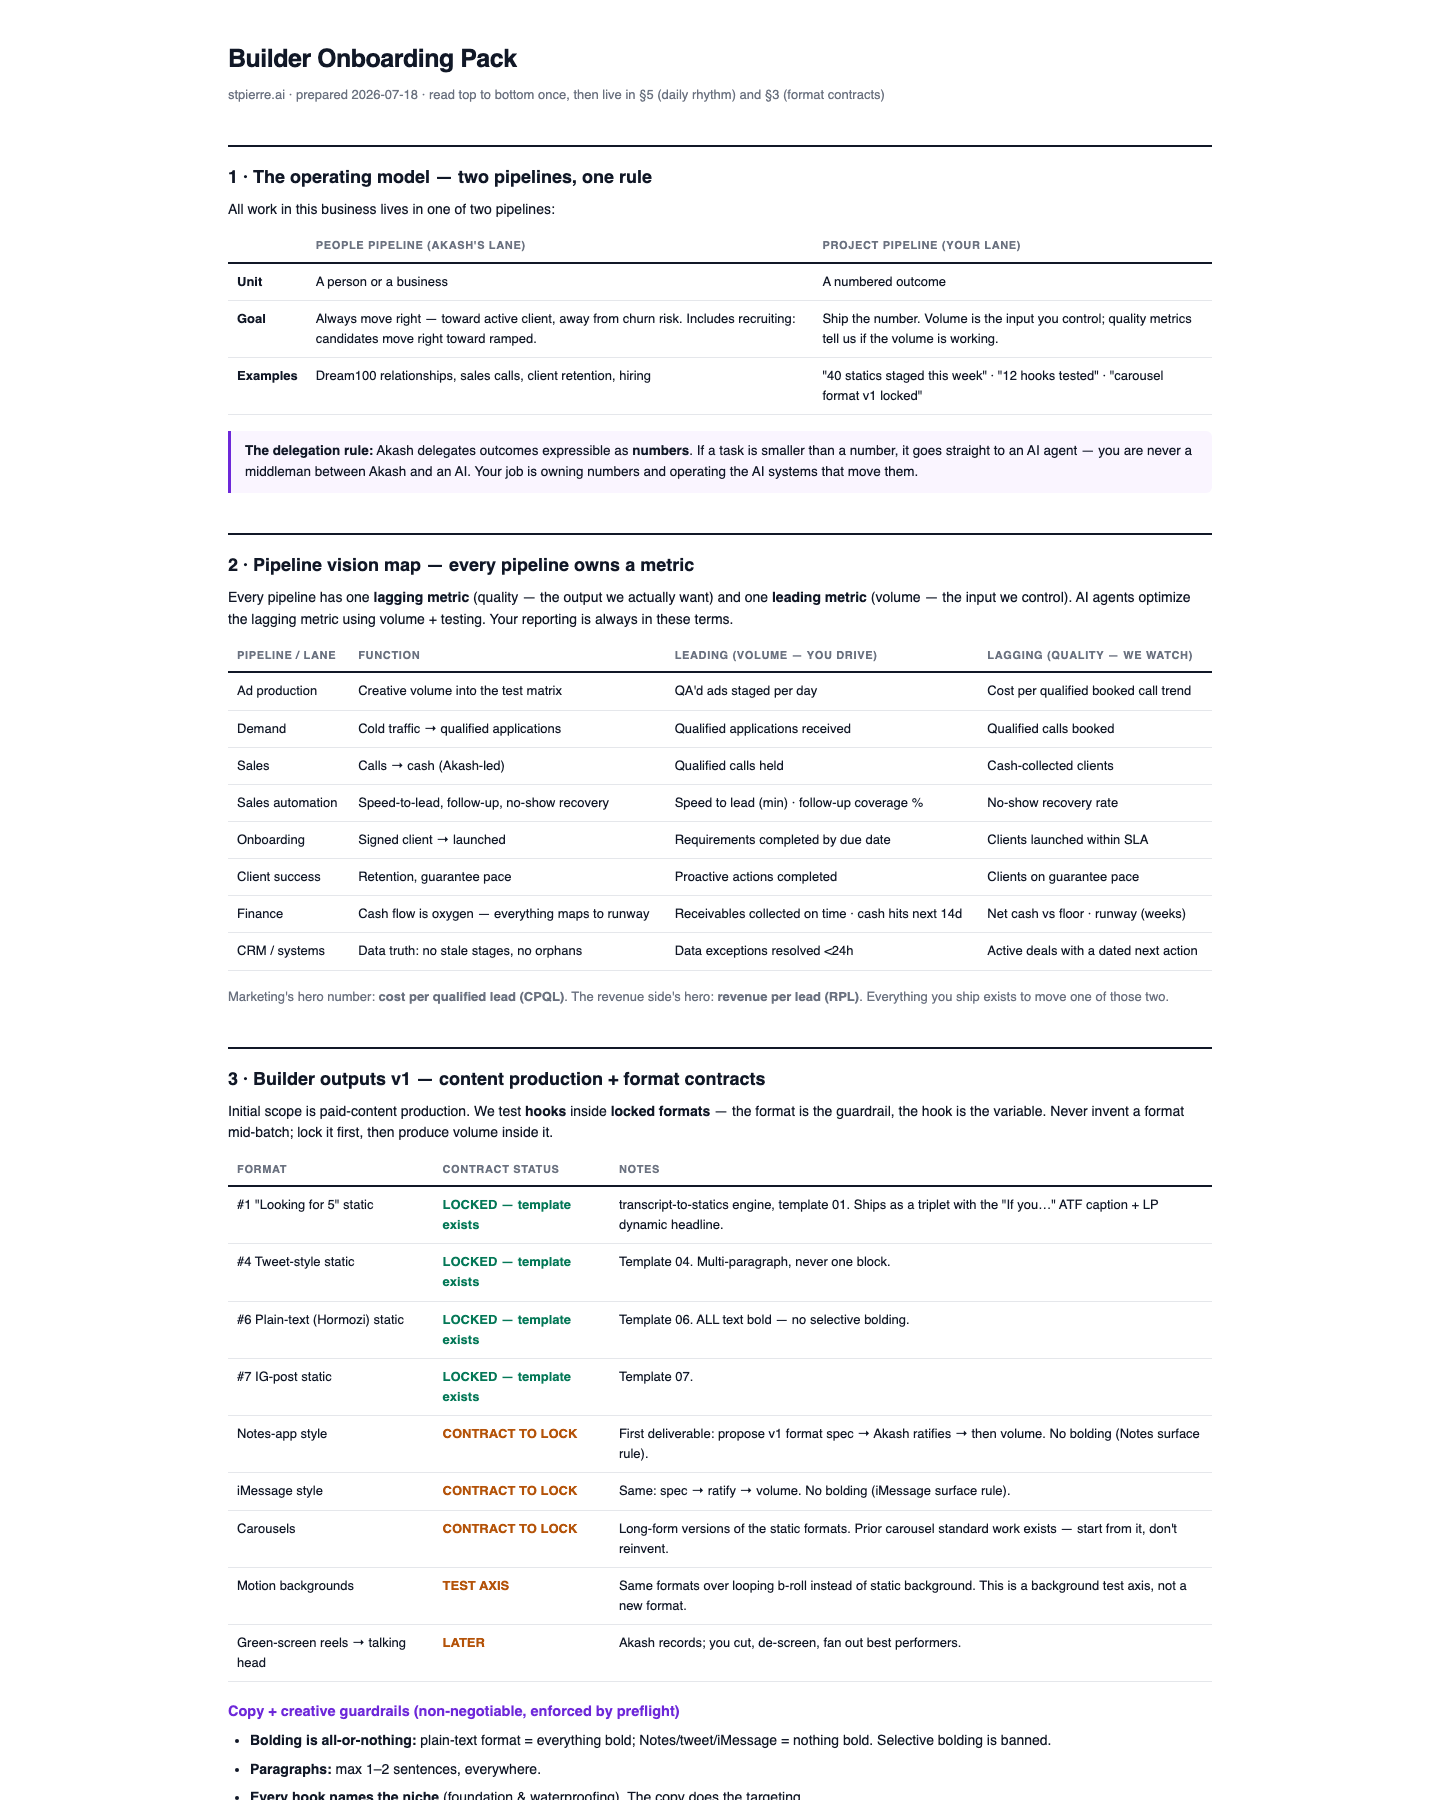
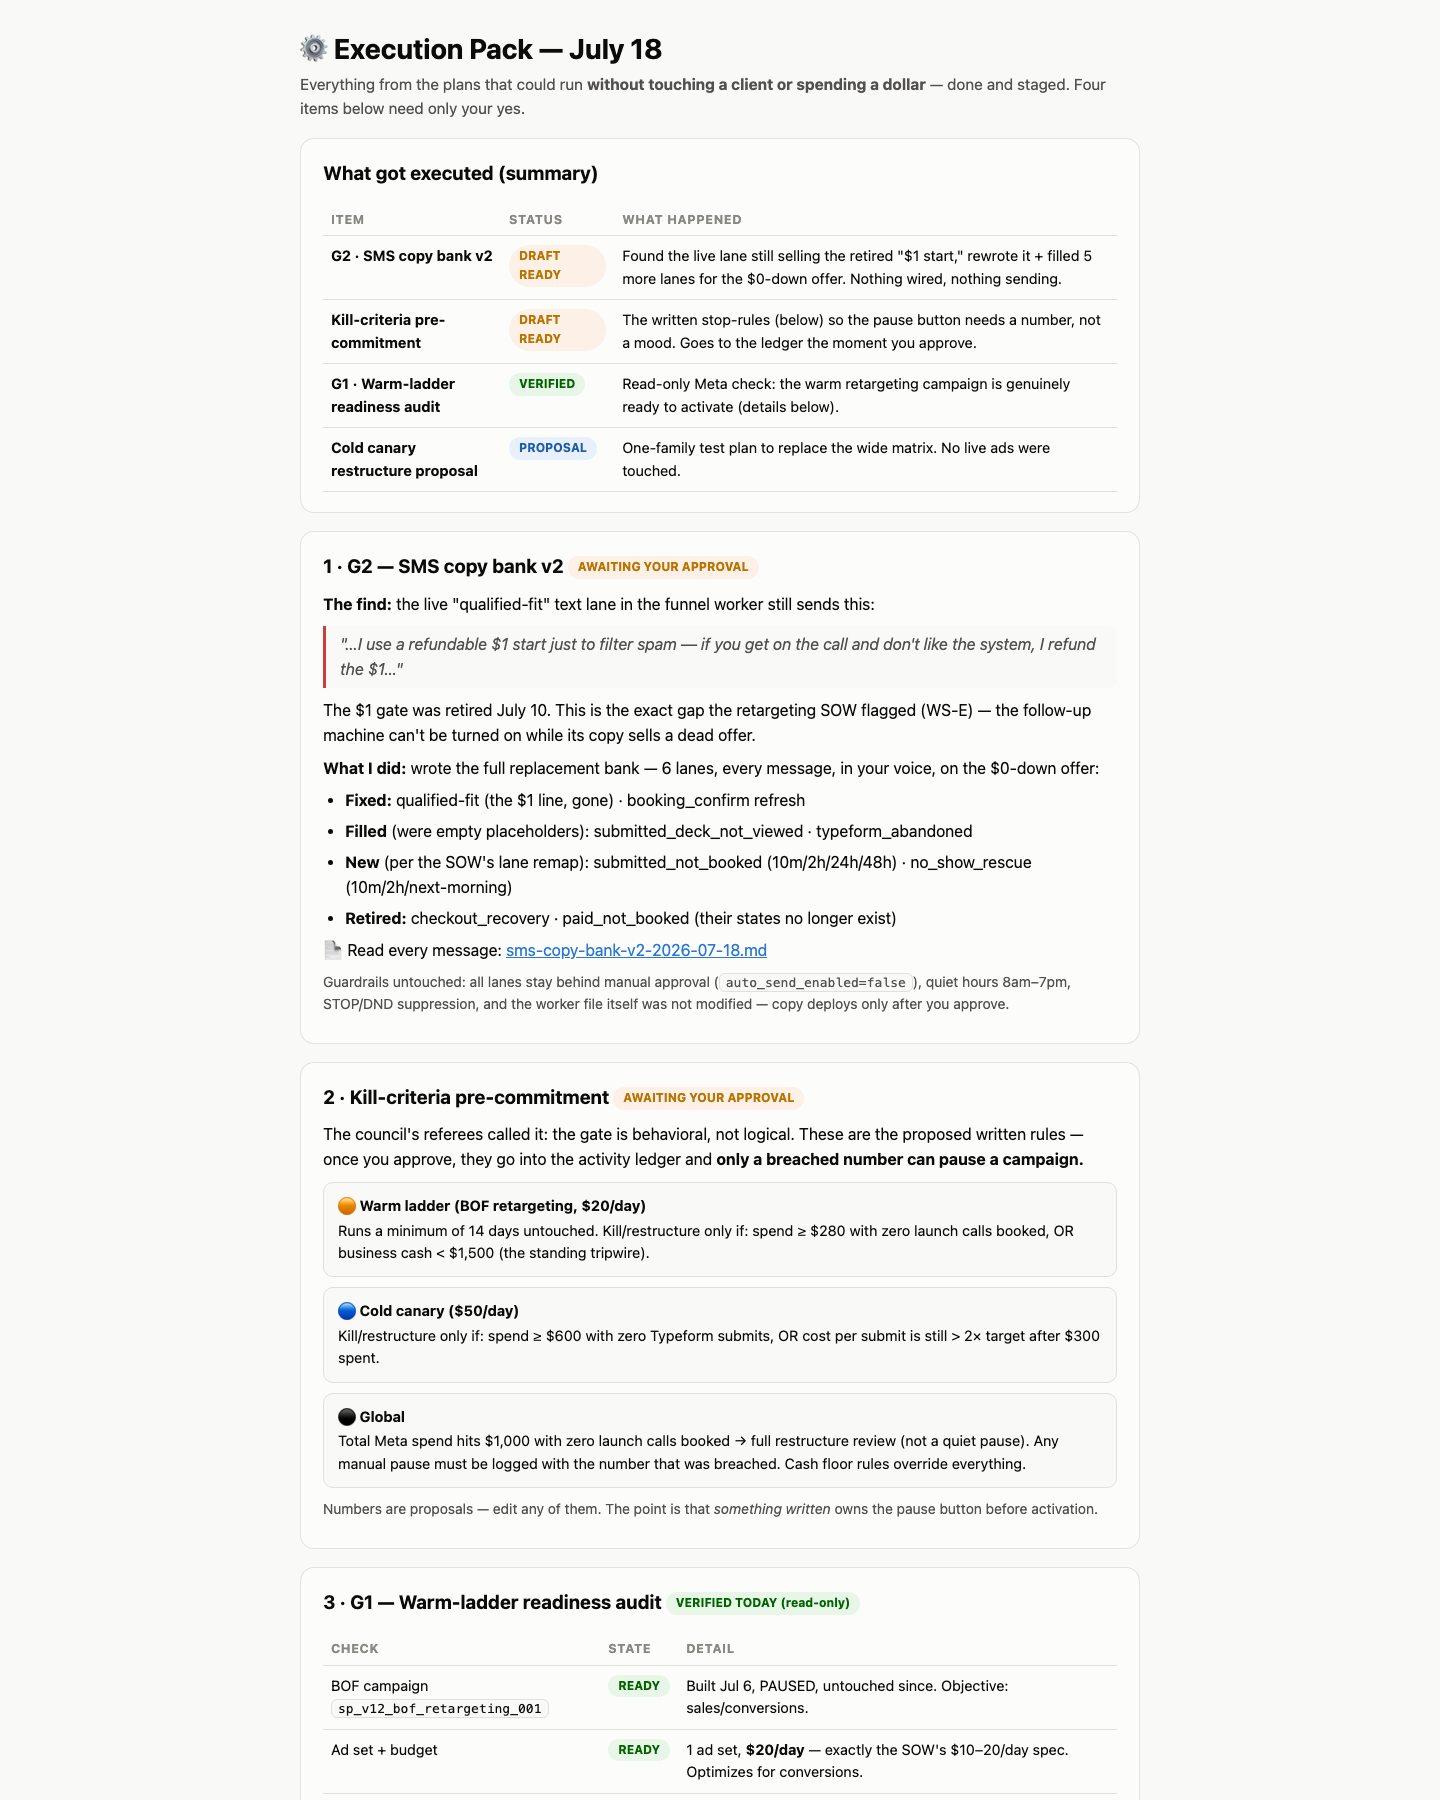
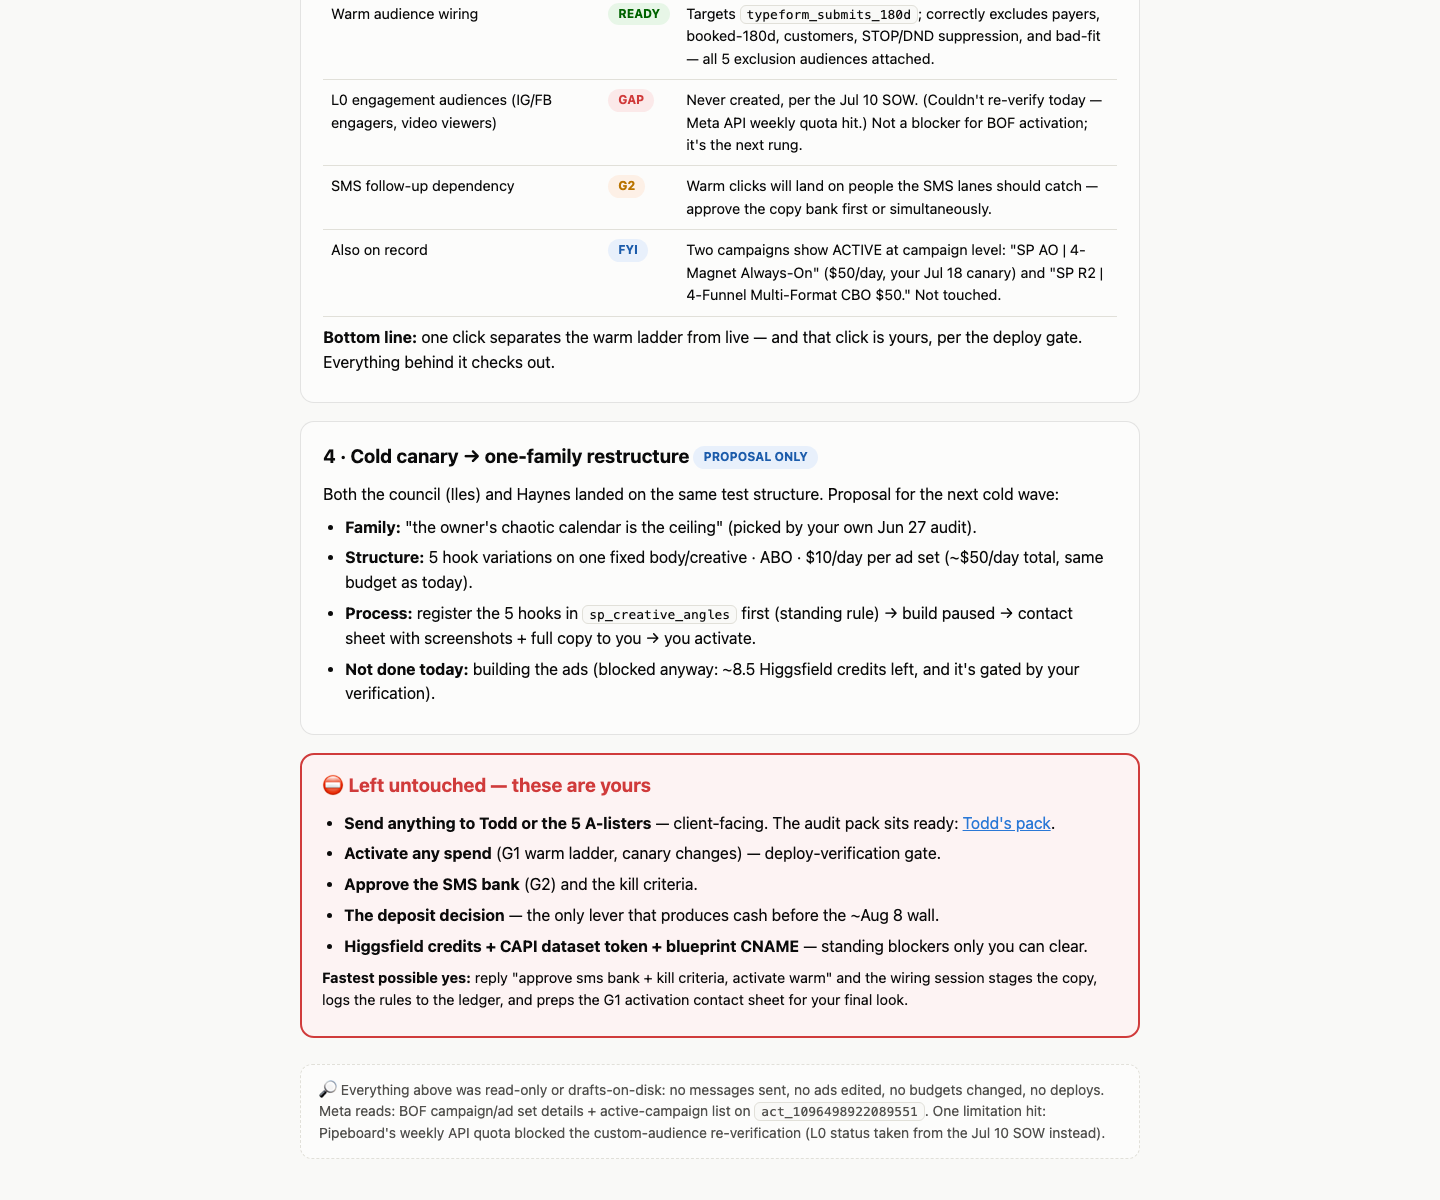
On-triggerInfra Backlog / Builder Onboarding / Execution PackSprint planning / referenceWhat's the build plan / the rules / what shipped Jul-18?Reference docs. Read once, then link back as needed.

Mini glossary — the words that show up everywhere

MRR — monthly recurring revenue (repeat monthly client fees)
Runway — days/weeks of cash left before the account hits $0 (net cash ÷ burn)
Burn — how much money leaves the account per day/week on average
Floor — the minimum bank balance we refuse to go below
CPL — cost per lead (any form fill)
CPQL — cost per qualified lead (a niche-fit lead worth a call)
CPQBC — cost per qualified booked call
RPL — revenue per lead (cash collected ÷ leads)
CAC — customer acquisition cost (spend to win one client)
LTGP — lifetime gross profit (total profit from a client over their life)
AR — accounts receivable (money owed to us)
opex — operating expenses (the recurring cost of running)
P0 — top-priority task (P1, P2, P3 = lower)
RLS — row-level security (a database lock; a wrong key returns 0 rows)
v_dash — a curated "view" (safe read-only window) into a locked table
WIG — Wildly Important Goal (the one goal above all others)
DoD — definition of done (what "finished" means for a project)
ICE — Impact / Confidence / Ease (a way to rank projects)
RAG — Red / Amber / Green pacing status
LP — landing page (the page an ad sends people to)
VSL — video sales letter (a long-form sales video)
GHL — GoHighLevel, the client CRM (contact database)
SUR — show-up rate (booked calls that actually attend)
SLA — service-level agreement (a target turnaround time)
CBO / ABO — campaign / ad-set budget optimization (who controls the Meta budget)
Advantage+ — Meta's automated broad-targeting campaign type
DND / STOP — a contact who legally opted out of texts (reach by phone/email)
speed-to-lead — calling/texting a new lead within minutes
proxy — a stand-in number used until a real data feed exists
the bar — the target number for a metric this week

2 · The Verdict (consolidation map)

The hub lists 27 in-house surfaces (plus PostHog, a login-gated external view we keep as-is). Most of them are not really dashboards, and several overlap. Here is the headline and the full ruling.

27surfaces audited
12keep as live dashboards
1keep as a tool
5consolidate
7reclassify to a shelf
3deprecate

Verdict key: KEEP stays a live dashboard · TOOL kept but moves to a tools shelf · CONSOLIDATE folds into another board · RECLASSIFY is really a doc/report, move to a shelf · DEPRECATE retire it · BROKEN currently dead/empty.

Master table — all 27 surfaces

RoomDashboardVerdictWhy (one line)
💸 FinanceFinance Room finance.htmlKEEPCanonical daily cash cockpit; freshest, server-baked. This is the room.
💸 FinanceCompany ScorecardCONSOLIDATEWeekly cash tiles duplicate the room; fold its projections + bets + liabilities in.
💸 FinanceConsolidated P&LCONSOLIDATEUseful category P&L but stale (Jun-22); make it the room's P&L drill-down.
💸 FinanceProfit First P&LRECLASSIFYIt's a what-if modeling tool, not a report; move to a models shelf. Banned name in header.
💸 FinancePersonal FinanceDEPRECATE BROKENURL is dead (DNS error); Cash-OS merge made a separate personal board redundant.
📣 MarketingMarketing Room hubKEEPThe room's front door; fix the misleading "$0 live spend" tile.
📣 MarketingAds AutopilotKEEPThe operating cockpit; natural home of the CPQL hero graph.
📣 MarketingCreative RadarKEEPKeep for competitor/organic intel; drop its "Our Ads" tab; fix the branding.
📣 MarketingAds Pipeline BoardCONSOLIDATERead-only stuck-inventory snapshot; fold into Ads Autopilot.
📣 MarketingAttribution TimelineTOOLA per-lead drill-down, not a glanceable board; move to a tools shelf.
📣 MarketingPostHog AcquisitionKEEPAggregate channel view; complements the per-lead timeline. External (login).
📞 SalesSales Command CenterKEEPThe room's spine; honest about real vs test. Add a line-graph hero.
📞 SalesSunday Sales BriefRECLASSIFYA dated weekly report that duplicates the Command Center; move to a reports shelf.
📦 FulfillmentDelivery BoardKEEPThe only true dashboard here; fix the guarantee-pace feed.
📦 FulfillmentInstall SOPRECLASSIFY BROKENA 6-week playbook, not a dashboard; also a dead EyeFly link. Move to docs.
📦 FulfillmentWeek-1 RunbookRECLASSIFYAn onboarding checklist, not a dashboard; banned name in title. Merge with Install SOP.
🏗️ ProjectsCockpitKEEPThe daily entry point; only board here rendering live, useful data.
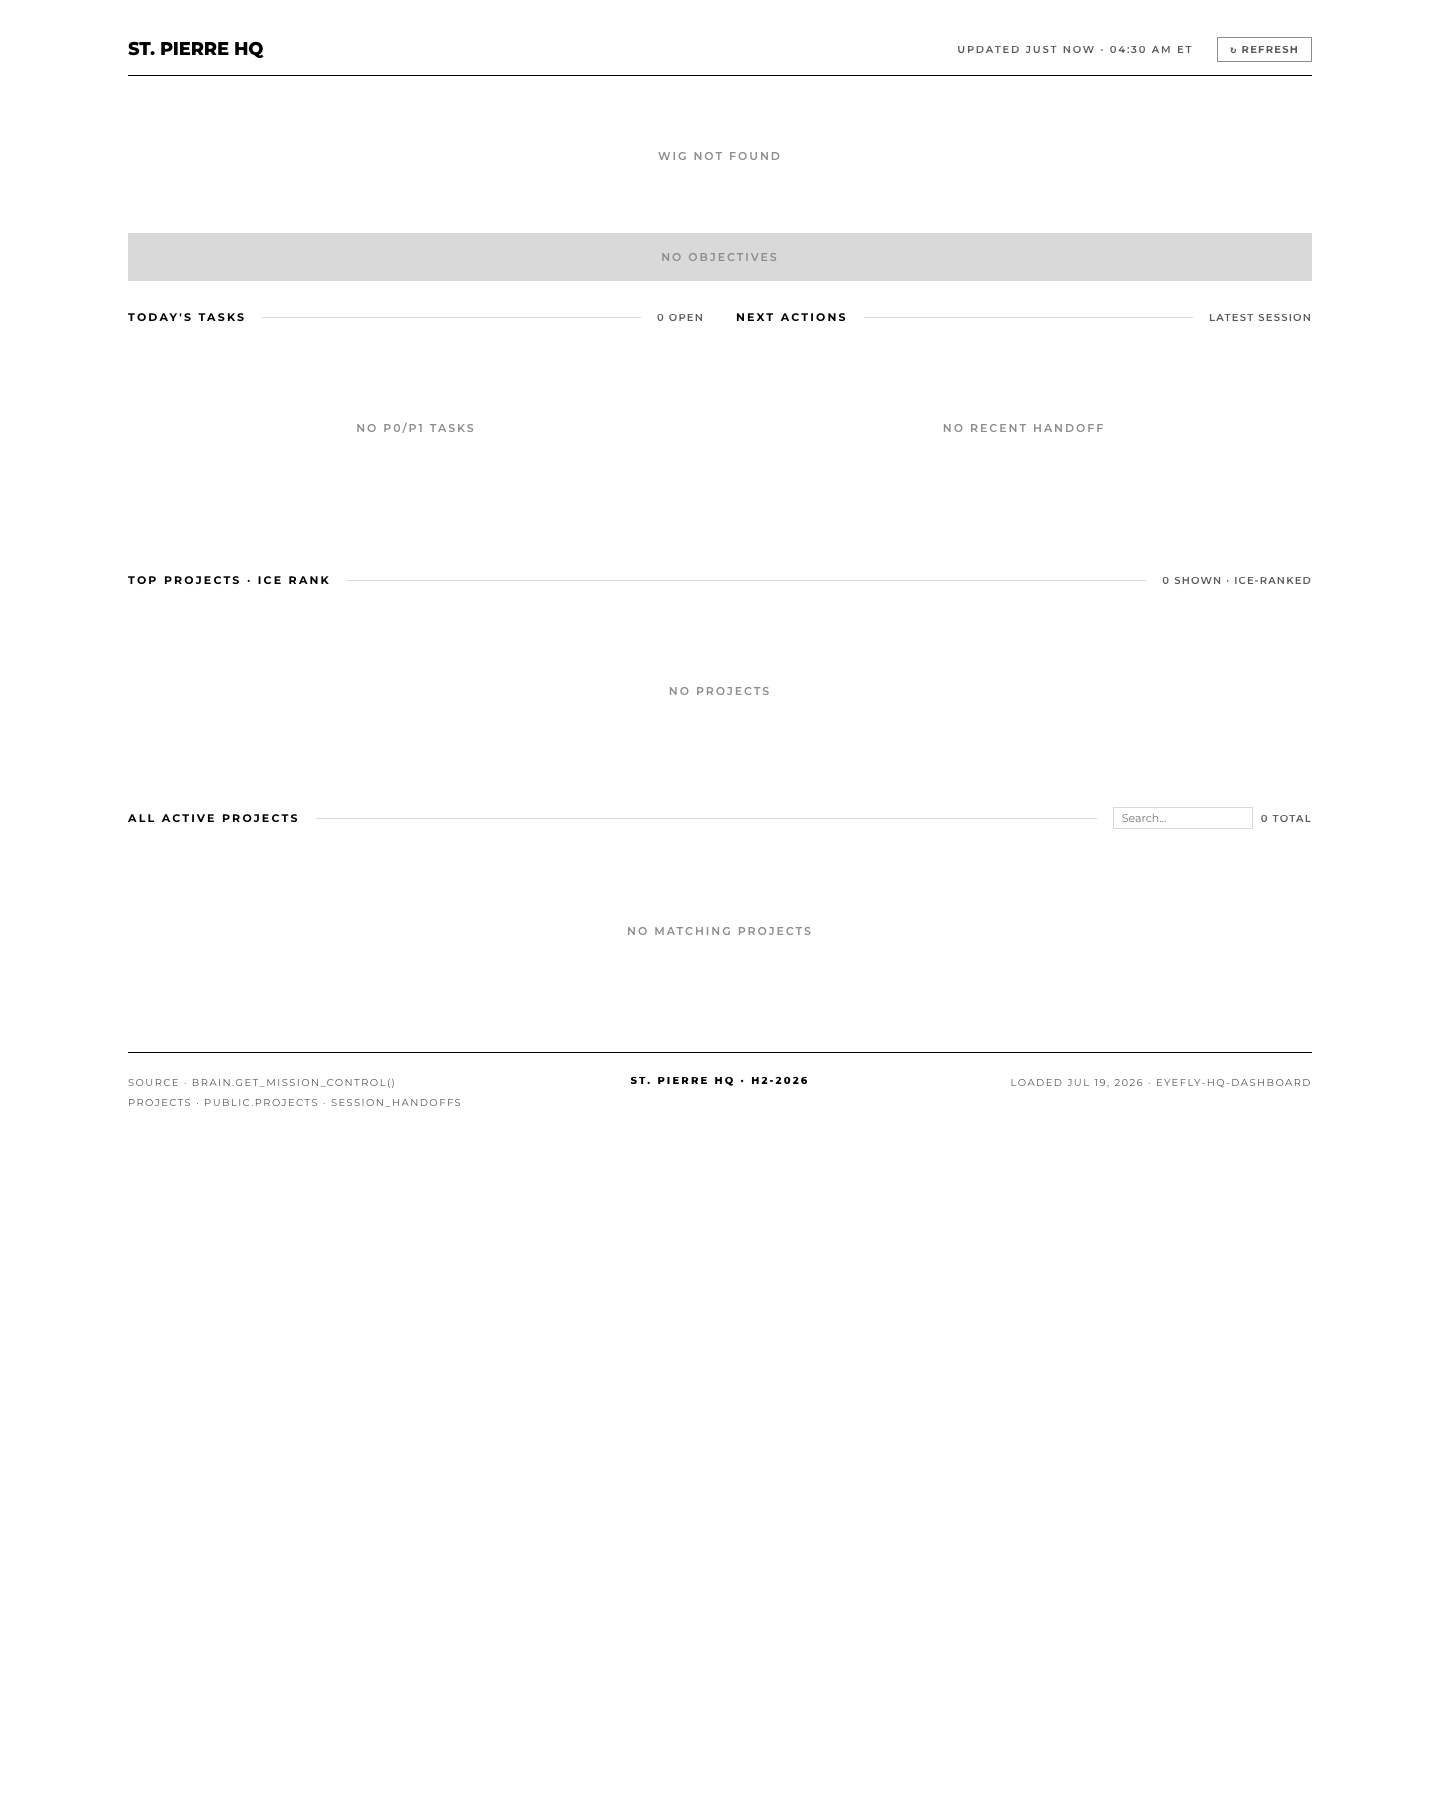
🏗️ ProjectsProject CheckCONSOLIDATE BROKENRenders 0 projects (RLS lockout); cockpit already shows this data live.
🏗️ ProjectsProjects (deployed)DEPRECATE BROKENByte-identical public mirror of Project Check; also empty.
🏗️ ProjectsInfra BacklogRECLASSIFYA 6-week SOW build plan, not a dashboard. Move to docs.
🏗️ ProjectsBuilder OnboardingRECLASSIFYAn onboarding doc read once. Move to docs.
🏗️ ProjectsExecution PackRECLASSIFYA dated one-off rollup; archive it, don't leave it in the live list.
🔁 LoopReview PanelKEEPThe room anchor: this-week actuals vs bars + agent ledger.
🔁 LoopTarget LockCONSOLIDATEReview Panel's other half; a dated weekly report. Fold into its Weekly Report tab.
🔁 LoopHQDEPRECATE BROKEN100% empty via RPC, EyeFly-branded; duplicates cockpit + north-star.
🔁 LoopNorth Star 2026KEEPAnnual-goals view; make it the single top-of-house objectives surface. Needs goal rows.
🔁 LoopAccomplishmentsKEEPThe reflection half of the loop; rich, real data.
🔁 LoopDisciplinesKEEPThe "did I run the loop?" meta-check; fix its logging, not its concept.

The recommended end-state

Per room: one canonical live dashboard, and everything else moves onto a labeled shelf so "the dashboards" list only contains things you actually monitor.

RoomThe one live dashboardWhat moves to a shelf
💸 FinanceFinance RoomCompany Scorecard + Consolidated P&L fold in · Profit First → Tools/models · Personal Finance retired
📣 MarketingAds Autopilot (+ hub as index)Ads Pipeline Board folds in · Attribution Timeline → Tools · Creative Radar & PostHog stay as weekly reads
📞 SalesSales Command CenterSunday Sales Brief → Reports shelf · :8765 cockpit stays a Tool, not a dashboard
📦 FulfillmentDelivery BoardInstall SOP + Week-1 Runbook → Docs/SOP shelf (merged into one Install Playbook)
🏗️ ProjectsCockpitProject Check + Projects-deployed retired · Infra Backlog + Builder Onboarding + Execution Pack → Docs shelf
🔁 LoopReview PanelTarget Lock → Reports shelf · HQ retired · North Star + Accomplishments + Disciplines stay as loop views

The three shelves the strays land on:

  • Reports shelf — dated, generated files (Sunday Sales Brief, Target Lock, Execution Pack). Produced on a schedule, not monitored live.
  • Docs / SOP shelf — playbooks and reference (Install SOP, Week-1 Runbook, Infra Backlog, Builder Onboarding).
  • Tools shelf — interactive utilities you act inside, not read (Attribution Timeline, Profit First model, the :8765 sales cockpit).

Cross-room redundancy — the same data shown many times

(a) Project data appears on 4 surfaces. Cockpit, Project Check, Projects-deployed, and HQ all try to show projects / finish-lines / tasks. Three of them are empty or broken. One survives: the Cockpit — its "what each part is trying to finish" section already shows this data live. The other three retire.
(b) THREE parallel target/actual systems exist. (1) the company scorecard_weekly with 25 metrics; (2) the Loop Engine's sp_department_* targets (6 lanes); (3) the Sales Command Center's own 24-metric contract. They use different tables and different metric lists, so "close rate" can mean three things. These must become one so a word means the same thing company-wide. (Akash decision.)
(c) Three surfaces show the same "our-ads spend" data. Creative Radar's "Our Ads audit" tab, Ads Autopilot's packs + what's-running, and the Ads Pipeline Board all list your ads with spend/impressions/leads. Ads Autopilot owns it; Creative Radar keeps only competitor/organic intel; the Pipeline Board folds in.

3 · KPI Scorecard (what we actually measure)

Before the rooms, the numbers. There is no single scorecard today — there are four overlapping ones, and only part of any of them is wired to real data. This is the honest state, then the recommendation.

Four overlapping KPI systems exist

SystemWhere it's definedMetricsStatus
A. St. Pierre weekly scorecardscorecard_metrics → view scorecard_weeklyweekly-scorecard.html25LIVE — this is the real one
B. Akash's "12 core metrics"memory note (Jul-18 voice directive)12Newest intent; not yet reconciled with A
C. Old EyeFly scorecardkpi_definitions; weekly-scorecard SKILL10STALE — data stopped ~Apr/May 2026
D. Cash OS company scorecardfinance_metric_snapshots; company-scorecard HTML~3Finance-only; point-in-time, no history

Plus two catalogs with no data feed: sp_metric_registry (51 draft metrics) and the Sprint-5 target tables (all current_value = 0).

Tracking health of the live 25 (System A)

13of 25 have data
12empty (no feed)
2silent collector bugs

Live with data (13): MRR ($31,450 vs $42K target), live-clients (40), new-deals, creatives-launched (566/wk), qualified-booked-calls (0s), calls-on-calendar, show-ups (0), live-qualified-calls (0), closes (0), cash-collected ($3,004/wk), new-convos, booked-appts (7/wk — the $200 money metric), at-risk-clients (1).

Empty — missing feed (12): net-new-mrr, churned-mrr, churned-clients, cpqbc, no-show-recovery, ltgp-per-call, pct-clients-on-guarantee-pace, client-facing-errors, satisfaction-response-time, time-to-kpi.

Silent collector bugs (2): sur (show-up rate) and close-rate both have a source query defined but land zero rows — they look like real zeros but are actually broken collectors.

Data recency: daily 06-26 → 07-17, weekly roll-up 06-22 → 07-13. The HTML was last generated Jul 11 (the render step isn't scheduled — the data is fresher than the page). Nearly every target carries target_is_guess = true — placeholders, not Akash-ratified.

Akash's 12-core directive vs what's tracked

Covered live: new ads (creatives-launched), qualified convos (new-convos), pending calls (calls-on-calendar), completed calls (show-ups/live-qualified — currently 0), onboarded (new-deals), live clients, inspections booked (booked-appts), MRR (partial).

The five holes — core items with no home in the scorecard:

#Core itemWhere it lives (if anywhere)
1Live adsNot in scorecard; only sp_ad_metrics_daily (last 07-14)
3LeadsNot in scorecard; lives in sp_funnel_events (live to 07-18)
10Inspections deliveredNOT TRACKED ANYWHERE
11ExpensesOnly Cash OS point-in-time (no history)
12Churn + net-new / projected MRRchurned-clients / churned-mrr / net-new-mrr all EMPTY

RECOMMENDATION — one core KPI, then three per department

The single company KPI is Runway (weeks) = net cash ÷ weekly burn. Per the Cash OS directive, "runway is THE number." Every other metric below is a leading signal that ultimately moves runway.

Under it, at most three KPIs per department. Green = tracked today, amber = partially, red = not tracked.

RoomDept KPILead/LagTracked today?
💸 FinanceRunway to $0 (days)LaggingYes (point-in-time tile)
Trailing-30d burn ($/day)LeadingYes ($139.95/day)
SP cash collected (sprint) → CPQL/RPLLaggingPartial (proxy $0; CPQL/RPL not computed)
📣 MarketingCPQL — cost per qualified lead (hero)LeadingNo (biggest gap; not wired)
New ads launched / weekLeadingYes (counts built, not live)
Qualified leads / weekLag→leadPartial (no "qualified" flag)
📞 SalesRPL — revenue per lead (hero)BridgeNo (named nowhere on screen; denominator unresolved)
Real booked calls / weekLeadingYes (honest 0)
Cash collectedLaggingYes (honest $0)
📦 Fulfillment% clients on guarantee pace (hero)LeadingNo (target NULL for 40/40 clients)
Booked appointments / inspections / weekLaggingYes (7/wk, the $200 metric)
At-risk clientsLeadingPartial (sources disagree: 1 vs 2)
🏗️ ProjectsInfrastructure completion %LeadingNo (hand-typed prose, no table)
Active projects w/ a dated next actionLaggingPartial (column exists, board RLS-locked)
Numbered outcomes shipped / weekLeadingNo (nothing rolls it up)
🔁 LoopRolling weekly hit-rateLeadingYes (33% now)
Ritual adherence rateLeadingPartial (log understates)
Weekly throughput (to-dos / week)LaggingYes (~100/wk)

Line-graph readiness — recommendation #1

Akash's standard: every kept dashboard should open with a 12-week line-graph hero. Today that's mostly impossible — the history doesn't exist yet.

  • Only ~13 metrics have any history, and only ~4 weekly points each (MRR / live-clients / at-risk have just 2 weekly points).
  • Cash / runway has 1 snapshot total — finance_metric_snapshots holds a single row of net_cash + runway_weeks, so no burn/runway line can be drawn yet.
  • The old weekly_kpi_snapshots table has 387 rows back to Jan 2025, but they're stale EyeFly codes — useless for current SP graphs.
Fix #1 (data plumbing): wire a nightly KPI snapshot job that appends every core + department KPI to scorecard_values and finance_metric_snapshots — append, never overwrite. The 06:15 chain already runs; it just needs to accrue a series instead of replacing one row. Until then, every "hero line graph" below is aspirational.

Recommended hero line series per kept dashboard (what each should trend once history accrues):

DashboardHero line series
Finance Room(1) business cash vs floor · (2) runway days-to-$0 · (3) trailing-30d burn
Cockpit(1) net cash / runway-days · (2) daily burn
Ads Autopilot / Marketing hub(1) CPQL over time · (2) new ads launched/week · (3) qualified leads/week (+ daily live-ad count)
Creative Radarlink-CTR + leads over time for the top packs
Sales Command Center(1) real booked calls/week · (2) cash collected/week · (3) RPL
Delivery Board(1) % clients on guarantee pace · (2) at-risk client count
Review Panel(1) rolling weekly hit-rate · (2) off-track count
North Stargoal-progress % over time, RAG-banded, per goal
Accomplishmentsto-dos-finished-per-week (or hands-on hours/week)
Disciplinesritual-adherence % per day (7-day trend)

4 · 💸 Finance Room

The room in plain English

This room answers one question: can the business survive long enough to earn its first client cash? Cash flow is oxygen, and right now the business is breathing through a straw.

Per the Cash OS directive (Jul 18), personal and business money are managed as one pool for operations — so the room blends them for survival, while keeping them separate for profit-and-loss and tax.

The hero number is runway = net cash ÷ weekly burn. Today the story is stark: business cash is $2,826.18, which is $376.03 below the draft cash floor, and the account reaches $0 in about 20 days at the current burn of $139.95/day. No St. Pierre client revenue is live yet; this month leaned on a $3,000 Fundbox loan draw — a warning sign, not income. The room's daily job is to point at the one move that brings cash in before the floor breaks.

Room KPI recommendation

Core company KPI this room feeds: Runway (days/weeks of cash before $0).

  • 1. Runway to $0 (days)tracked (point-in-time). Lagging. Reads 20.2 days to $0 / 0 days to the draft floor.
  • 2. Trailing-30-day burn ($/day)tracked. Leading. $139.95/day.
  • 3. SP cash collected (sprint) → CPQL / RPLpartial. The number renders ($0.00) but it's a proxy, and CPQL/RPL are computed on no finance surface today.

Reconciliation: the KPI synthesis confirms Cash OS metrics live only in finance_metric_snapshots (1 row each, no history). The numbers exist for today, but there is no time-series to trend them yet.

Consolidation verdict

DashboardVerdictWhy
Finance RoomKEEPCanonical, freshest (Jul 18), server-baked off the 06:15 chain. This is the room.
Company ScorecardCONSOLIDATELocal, week-of Jul-13; cash tiles duplicate the room. Fold in its projections, bets, liabilities.
Consolidated P&LCONSOLIDATELive but stale (Jun-22). Make it the room's linked P&L drill-down.
Profit First P&LRECLASSIFYAn interactive projection console, not a report. Move to a models shelf; fix banned name.
Personal FinanceDEPRECATEURL is dead (DNS error). Cash-OS merge already folded personal cash into the room.
Redundancy inside this room: the same three survival numbers print on three surfaces — and two cash figures don't even agree because they slice differently (business-only $2,826 vs combined −$198.85). Collapse to one canonical cash-safety block with business-only and combined labeled side by side. Debt is triplicated too: $4,988.73 = $1,989 cards + $3,000 Fundbox.
Finance Room KEEP LOCAL the daily cash-survival cockpit

What it is: the single daily cockpit — how much cash, how fast it's draining, how many days left, and the one move today. Status: LOCAL finance.html, rendered Jul 18 08:32, server-baked (numbers frozen from the analyst payload). When to open: every morning before 9am (built around an 8:05a tripwire check). Hero check: No line graph — it opens with a point-in-time margin tile + a forward outflow bar ladder. It should open with a line trending cash-vs-floor, runway days, and burn (blocked: only 1 snapshot row exists).

01 · Cash Safety
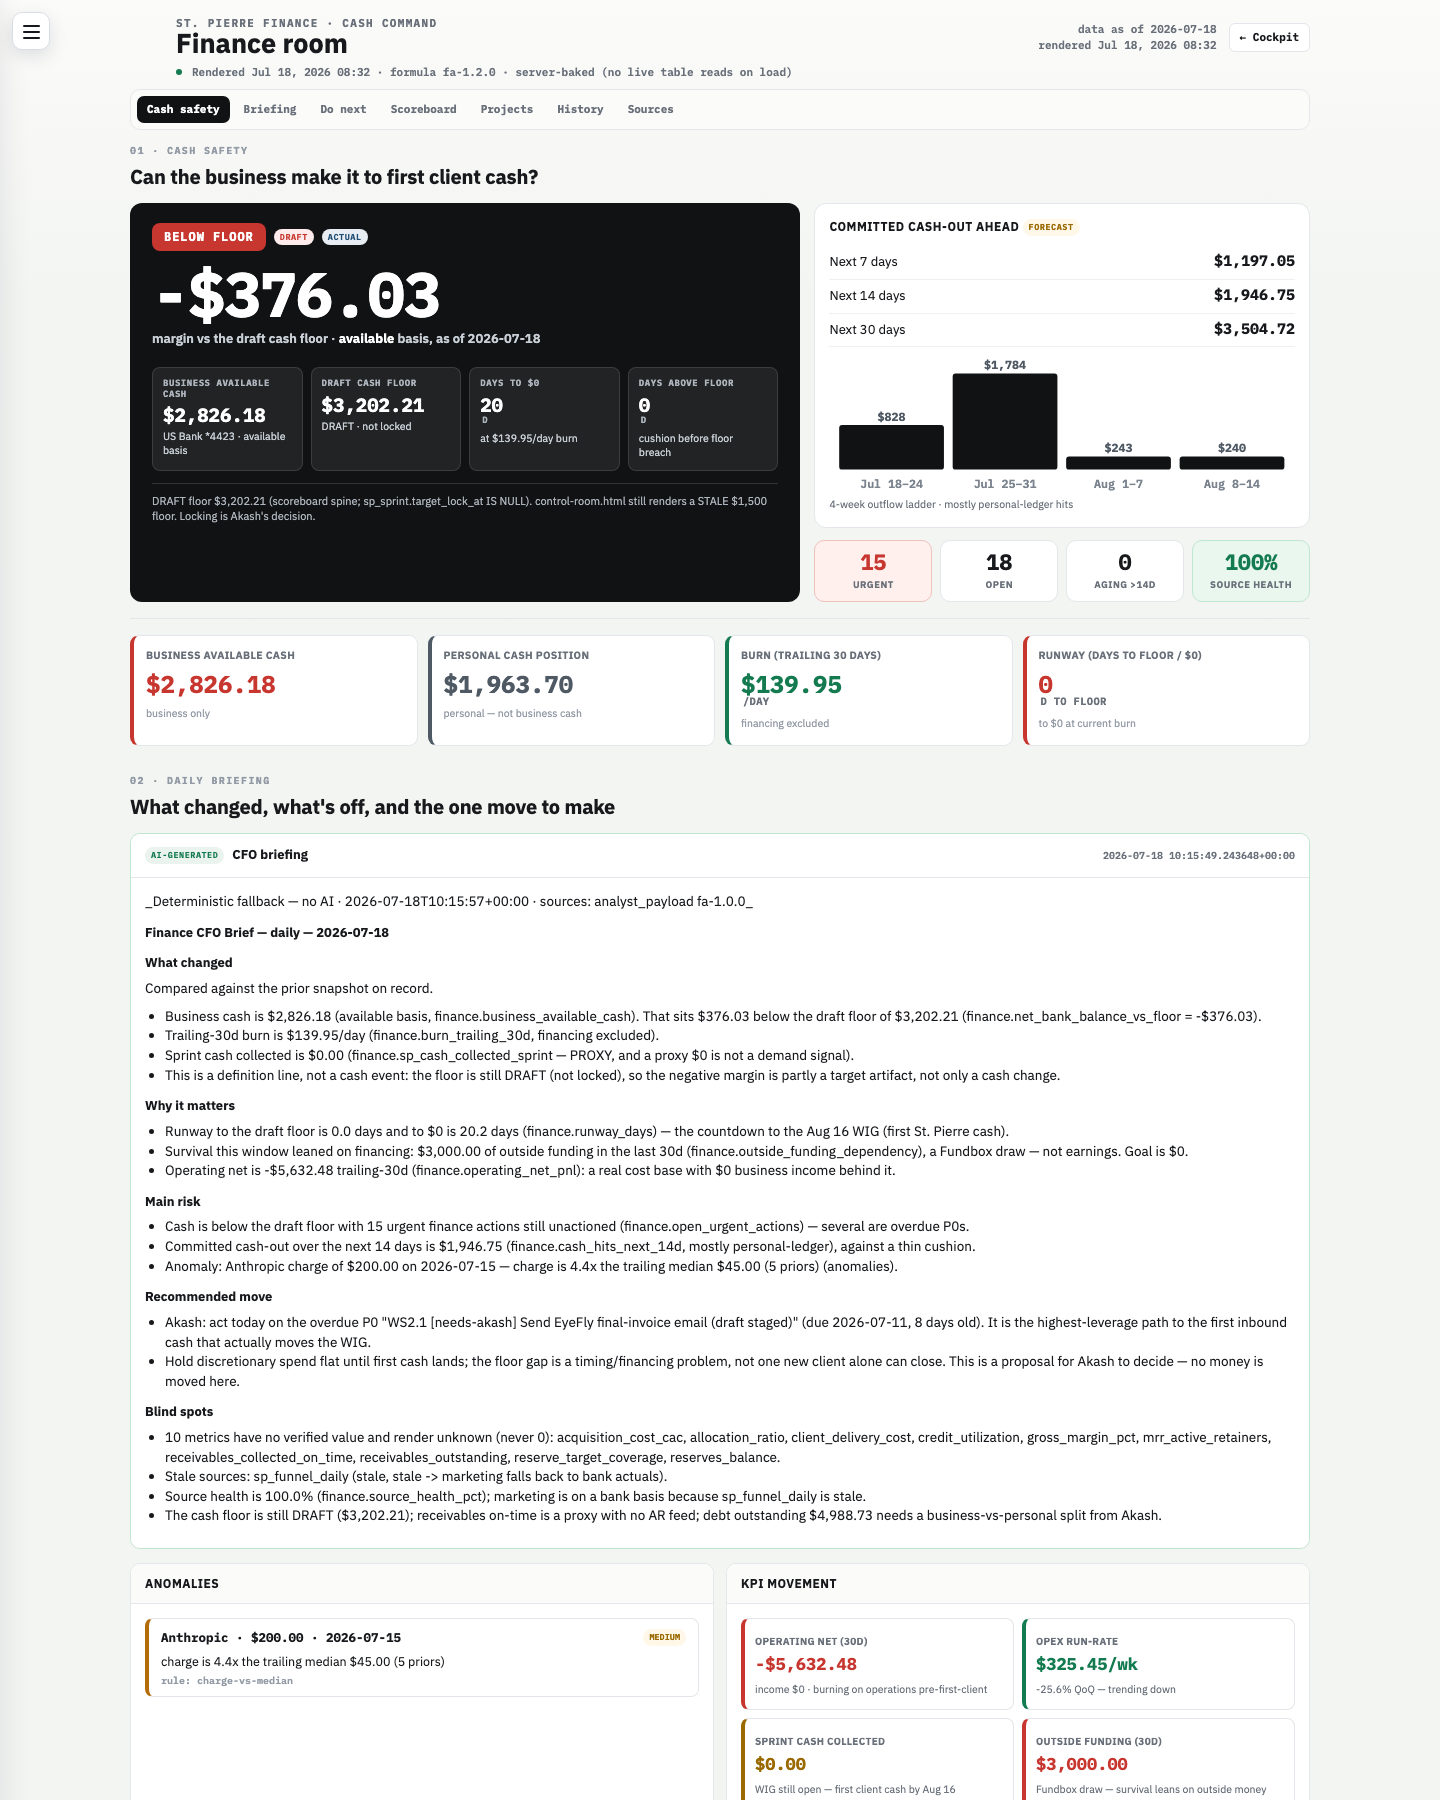
shots/finance-room-s01.png — Cash Safety + Daily Briefing
Finance Room cash safety
How to read itThe big black tile is cash-floor margin: how far above (green) or below (red) the safety floor the business is. Sub-tiles: business cash, the draft floor, days-to-$0, cushion days. "Committed cash-out ahead" forecasts money already promised to leave over 7/14/30 days.
What we see right nowBELOW FLOOR by $376.03. Note the DRAFT + ACTUAL tags — the $3,202.21 floor is not locked, so part of the red margin is a target artifact, not a cash drop. Committed outflow $1,197.05 (7d) / $1,946.75 (14d). Counters: 15 urgent / 18 open / 0 aging / 100% source health. Business cash $2,826.18 (red) vs personal $1,963.70 ("not business cash"), burn $139.95/day, runway 0 days to floor.
What to look forRed flag = margin negative AND floor locked (real breach, act now). Red flag = days-to-$0 under 7 (emergency). Green flag = positive margin with cushion > 0. Action on red: work the overdue P0 cash-in tasks in section 03.
02 · Daily Briefing
How to read itAn auto-written (or deterministic-fallback) CFO brief: what changed, why it matters, the main risk, the one recommended move, blind spots. Below it an anomalies panel flags weird charges and a KPI-movement strip trends key numbers.
What we see right nowIt's the deterministic fallback ("no AI · sources: analyst_payload"). Recommended move: act on the overdue P0 "Send EyeFly final-invoice email" (due Jul 11, 8 days old). Flags a $200 Anthropic charge Jul 15 as an anomaly (4.4× the $45 median). Blind spots: 10 metrics render "unknown"; sp_funnel_daily stale. KPI strip: operating net (30d) −$5,632.48, opex run-rate $325.45/wk (down 25.6%), sprint cash $0.00, outside funding $3,000.
What to look forRed flag = "outside funding" > $0 (survival on loans, not earnings). Red flag = an anomaly you didn't authorize (verify the $200 Anthropic charge). Green flag = a single specific recommended move you can do today.
03 · Do Next
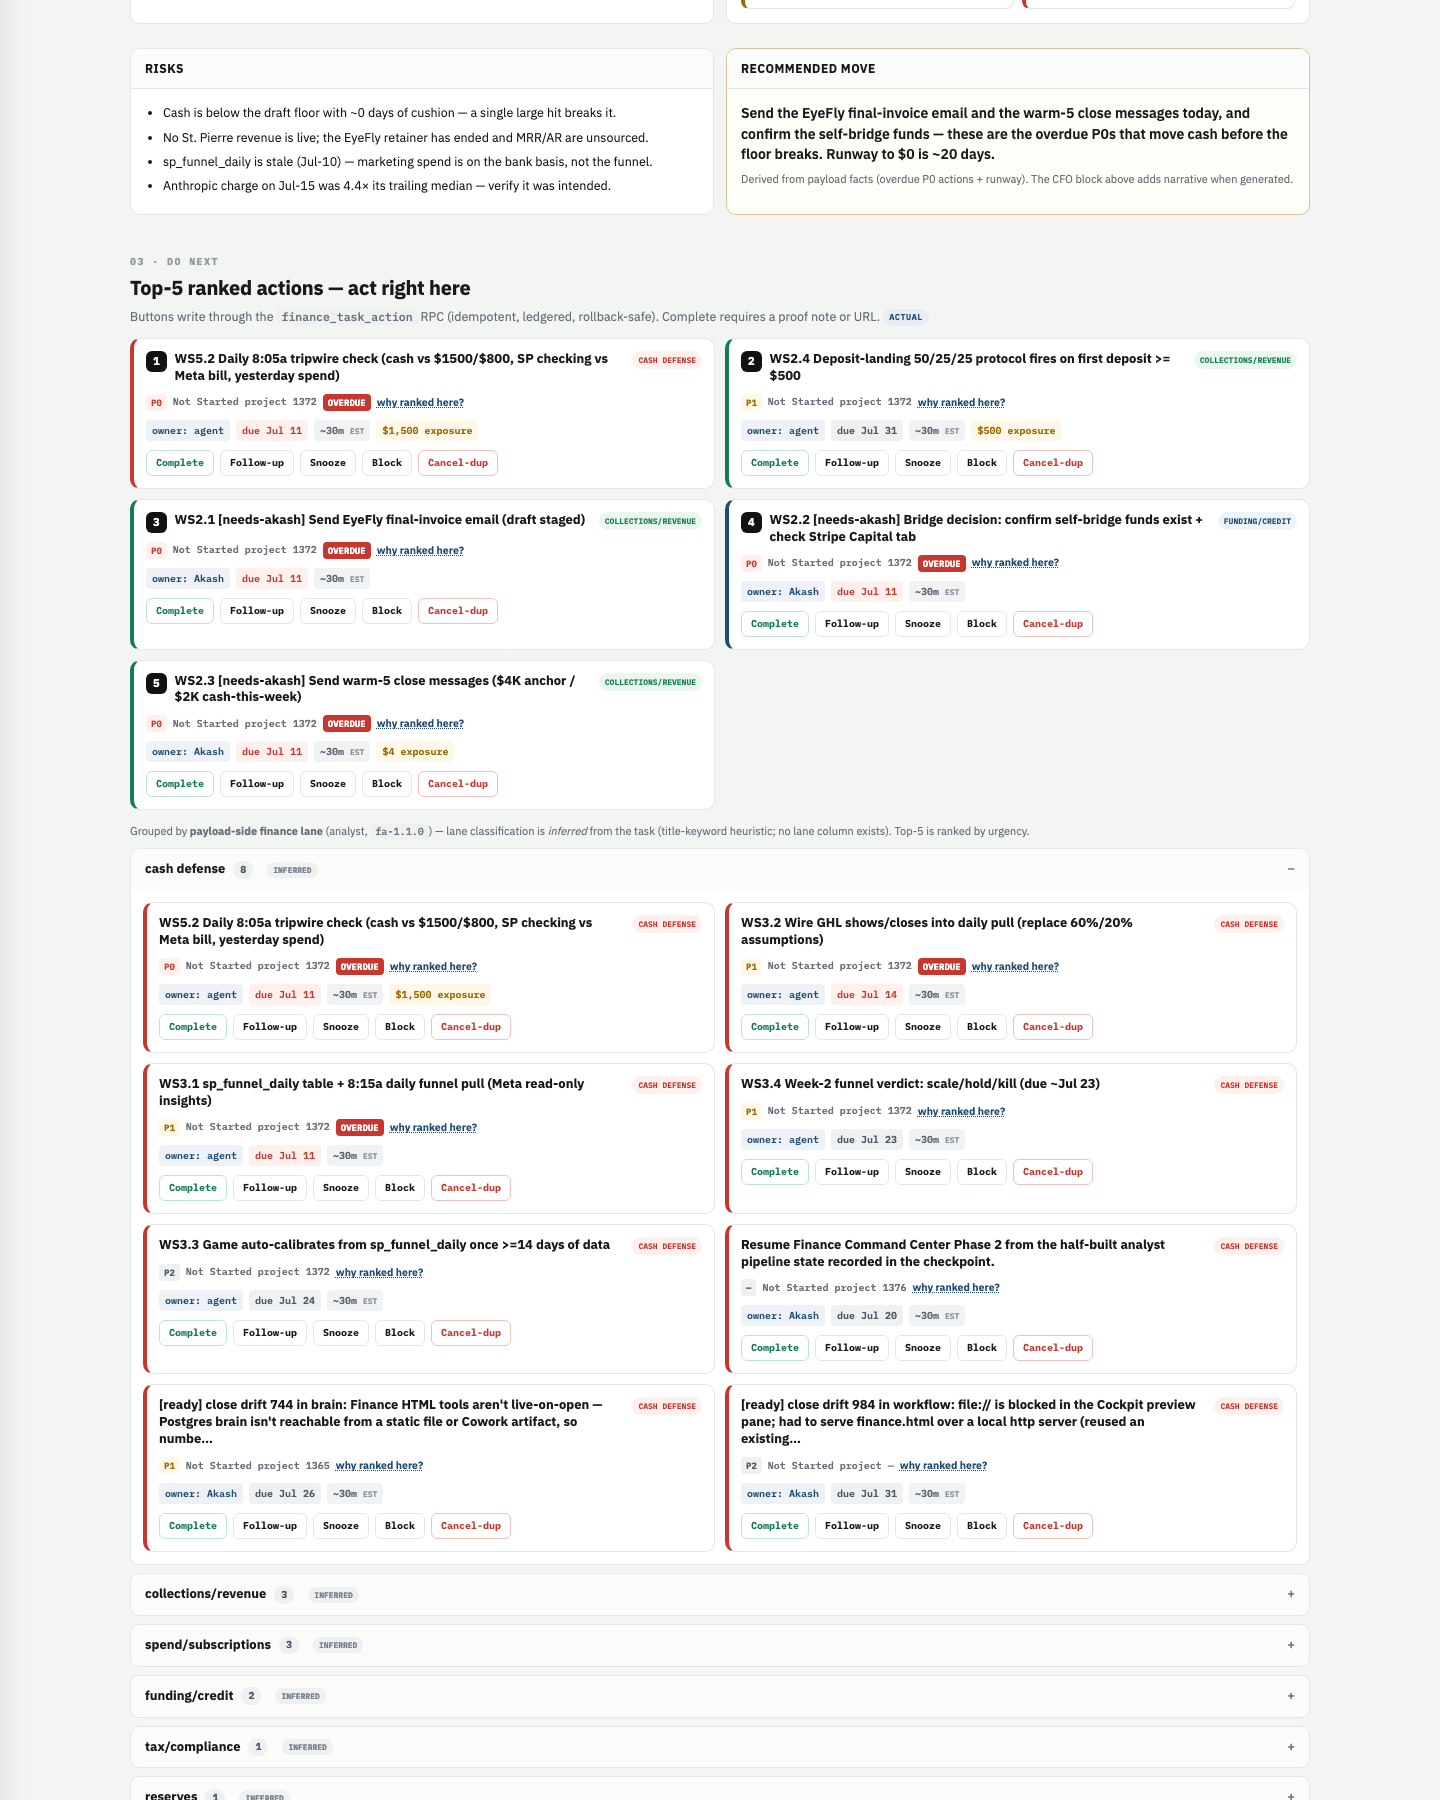
shots/finance-room-s02.png — Do Next action queue
Finance Room do next
How to read itThe top-5 most urgent finance actions, ranked, each with buttons (Complete / Follow-up / Snooze / Block / Cancel-dup) that write through a ledgered, rollback-safe action. Below, the full backlog grouped by inferred finance lane.
What we see right nowThree of the top-5 are OVERDUE P0s owned by Akash, all due Jul 11: send the EyeFly final invoice ($4K anchor), confirm self-bridge funds + check Stripe Capital, and send warm-5 close messages ($2K this week). The "cash defense" lane has 8 items, several overdue.
What to look forRed flag = P0s overdue by days (three are 8 days old). The lanes are inferred by keyword — no real lane column exists, so don't trust the grouping as gospel.
04 · Scoreboard (25 contract metrics)
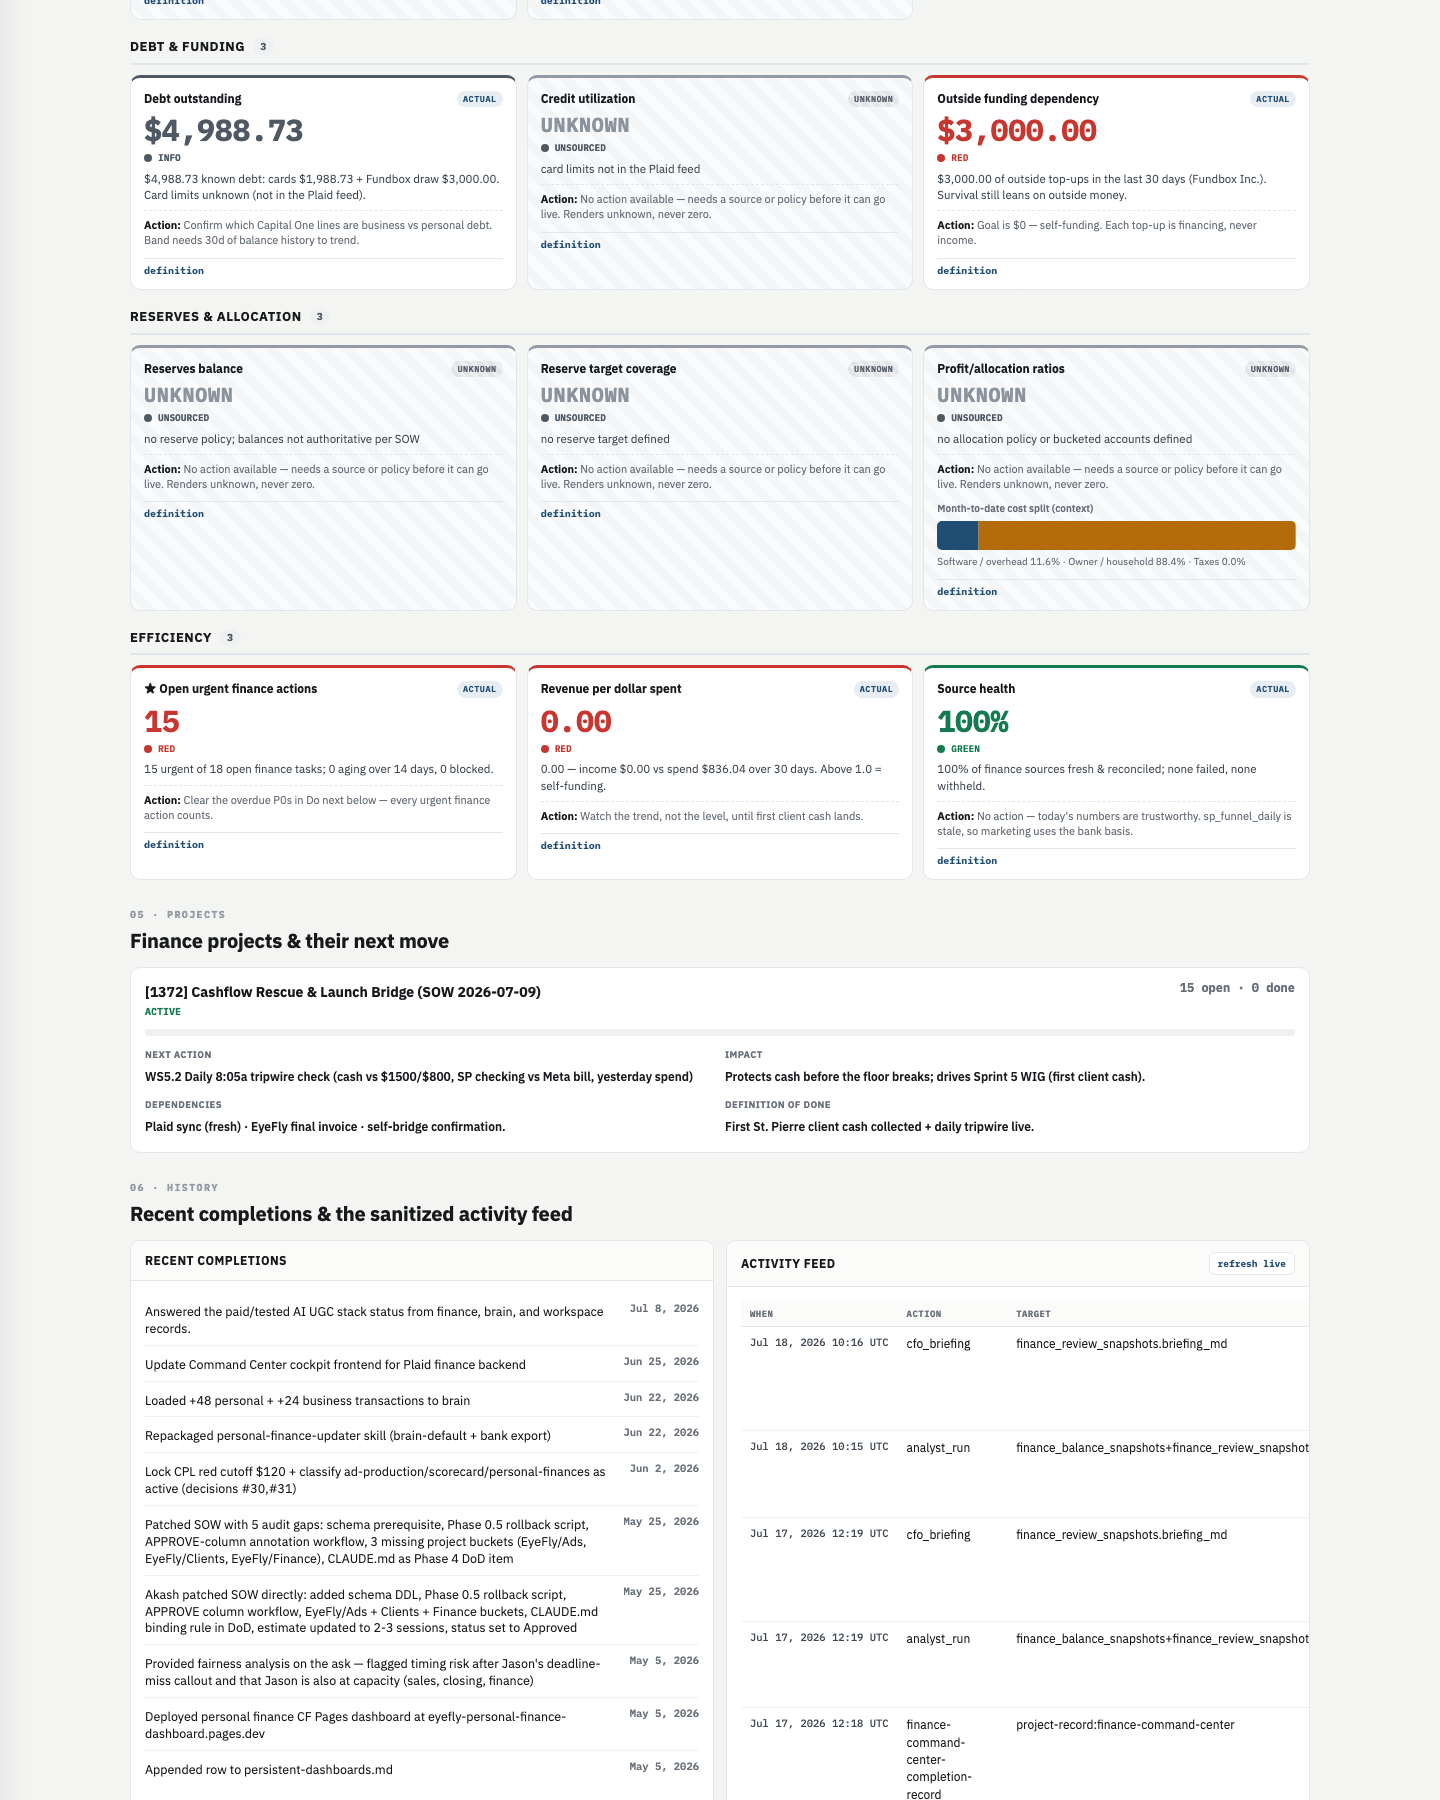
shots/finance-room-s03.png — Scoreboard
Finance Room scoreboard
shots/finance-room-s04.png — Scoreboard (cont.) + Projects
Finance Room scoreboard continued
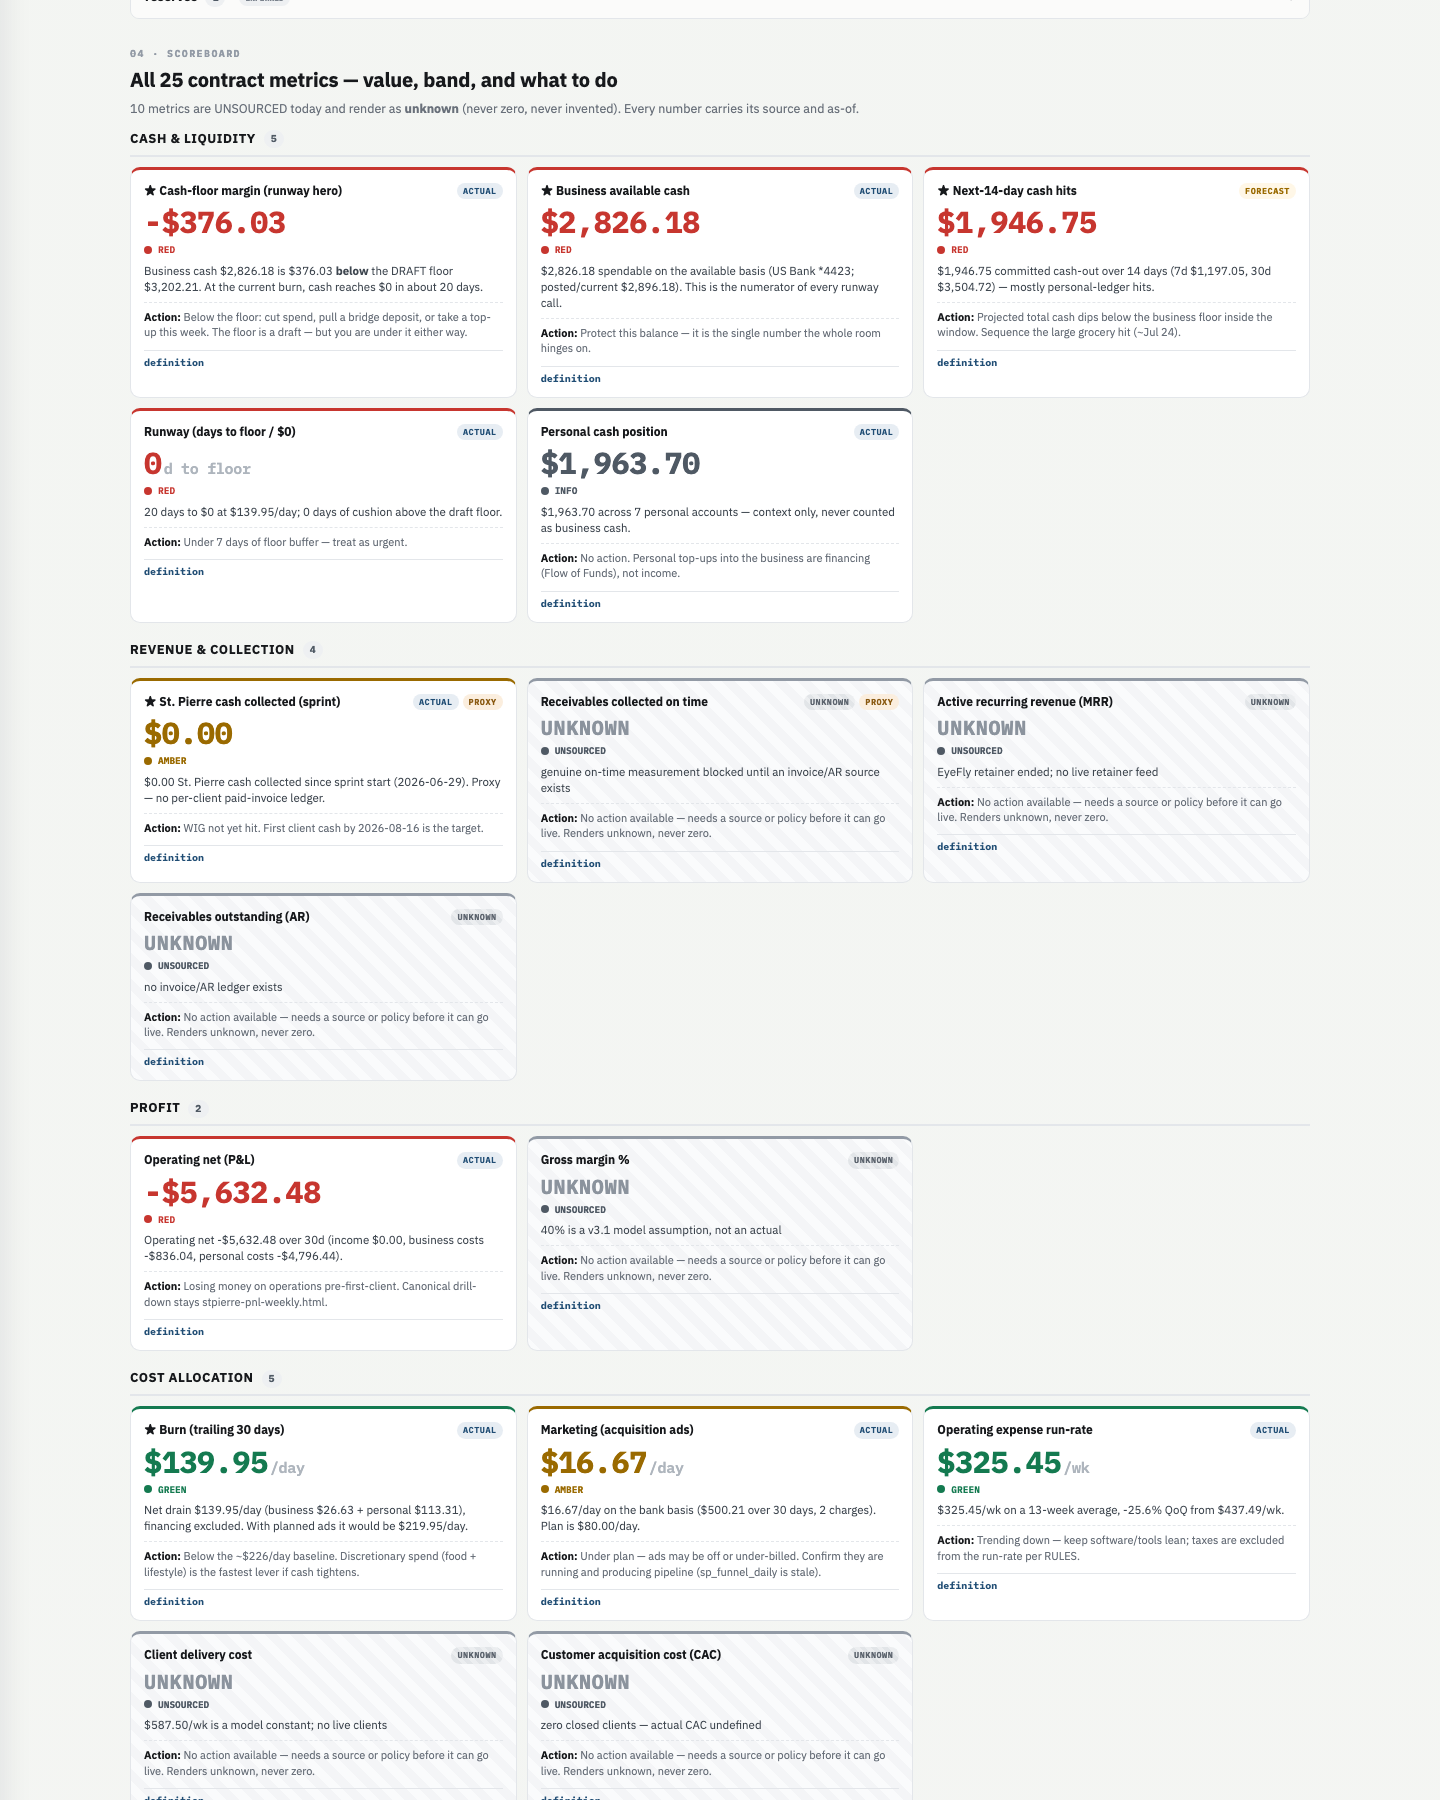
How to read itAll 25 contract metrics, grouped (Cash & Liquidity, Revenue, Profit, Cost, Debt, Reserves, Efficiency). Each has a value, color band, action line, source tag. Metrics with no source render UNKNOWN on a striped grey card — never a fake zero.
What we see right now10 of 25 are UNSOURCED: MRR, receivables/AR, gross margin %, delivery cost, CAC, credit utilization, reserves, coverage, allocation ratios. Hero metrics: cash-floor margin −$376.03 (red), business cash $2,826.18 (red), next-14d hits $1,946.75 (red), burn $139.95/day (green — below ~$226 baseline), open urgent 15 (red), revenue-per-dollar-spent 0.00 (red, $0 income vs $836 spend). Marketing acquisition ads $16.67/day amber (plan $80/day).
What to look forRed flag = the count of UNKNOWN metrics (10 is a lot; each needs a source). Green flag = burn in green. Striped grey cards aren't broken — they honestly say "no data feed yet."
05 · Projects
How to read itThe active finance project(s) with next action, impact, dependencies, definition-of-done.
What we see right nowOne project: [1372] Cashflow Rescue & Launch Bridge (SOW Jul-09), 15 open / 0 done. Next action = the daily tripwire check; DoD = "First St. Pierre client cash collected + daily tripwire live." Dependencies: Plaid sync, EyeFly final invoice, self-bridge confirmation.
What to look forRed flag = 15 open / 0 done with overdue next-actions (project isn't moving). Green flag = the DoD is concrete and cash-tied.
06 · History
How to read itRecent completions and a sanitized live activity feed, plus source snapshots and assumption-change log.
What we see right nowActivity feed shows cfo_briefing and analyst_run events Jul 17–18. Snapshots: Daily Jul-18 formula fa-1.2.0. Assumption changes: none recorded yet (finance_assumption_changes is empty). Recent completions run back to May/June (Plaid backend, transaction loads).
What to look forGreen flag = fresh analyst_run timestamps. Red flag = empty assumption log when you know assumptions changed (changes aren't being logged).
07 · Sources & Memory
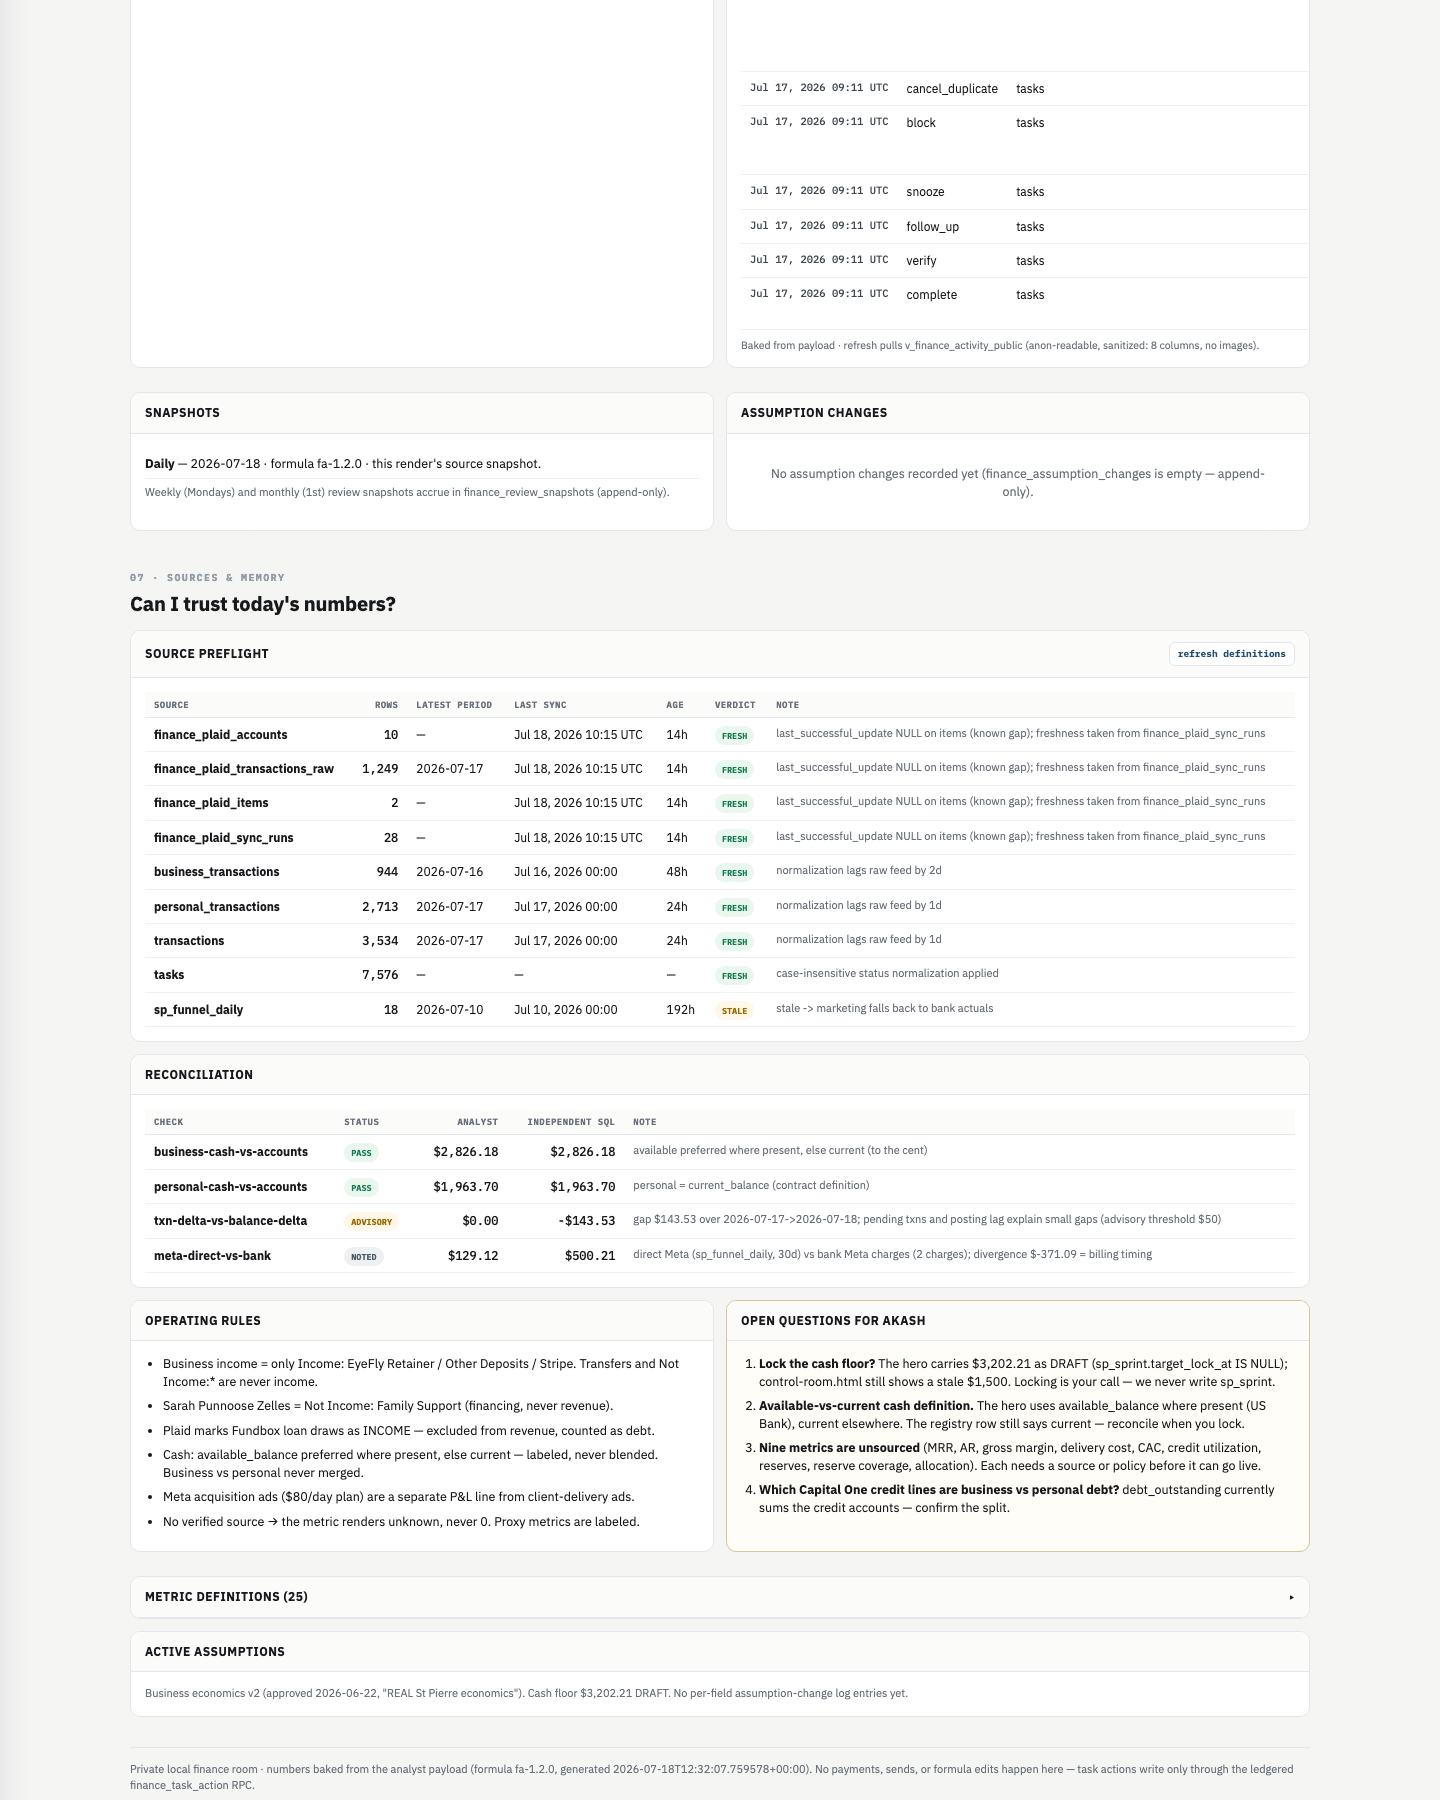
shots/finance-room-s05.png — Sources & Memory / reconciliation
Finance Room sources
How to read it"Can I trust today's numbers?" — a source preflight table (each source, rows, last sync, FRESH/STALE), a reconciliation table (analyst number vs independent SQL), operating rules, and open questions for Akash.
What we see right now8 sources FRESH, 1 STALE (sp_funnel_daily, 192h old → marketing falls back to bank actuals). Reconciliation: business-cash and personal-cash PASS to the cent; txn-delta ADVISORY (−$143.53 posting lag); meta-vs-bank NOTED ($371 billing-timing). Four open questions for Akash: (1) lock the cash floor (control-room still shows stale $1,500), (2) confirm available-vs-current cash, (3) nine metrics unsourced, (4) which Capital One lines are business vs personal.
What to look forRed flag = any source STALE feeding a hero metric. Green flag = reconciliation checks PASS. The open-questions box is the to-do list for making the room trustworthy.
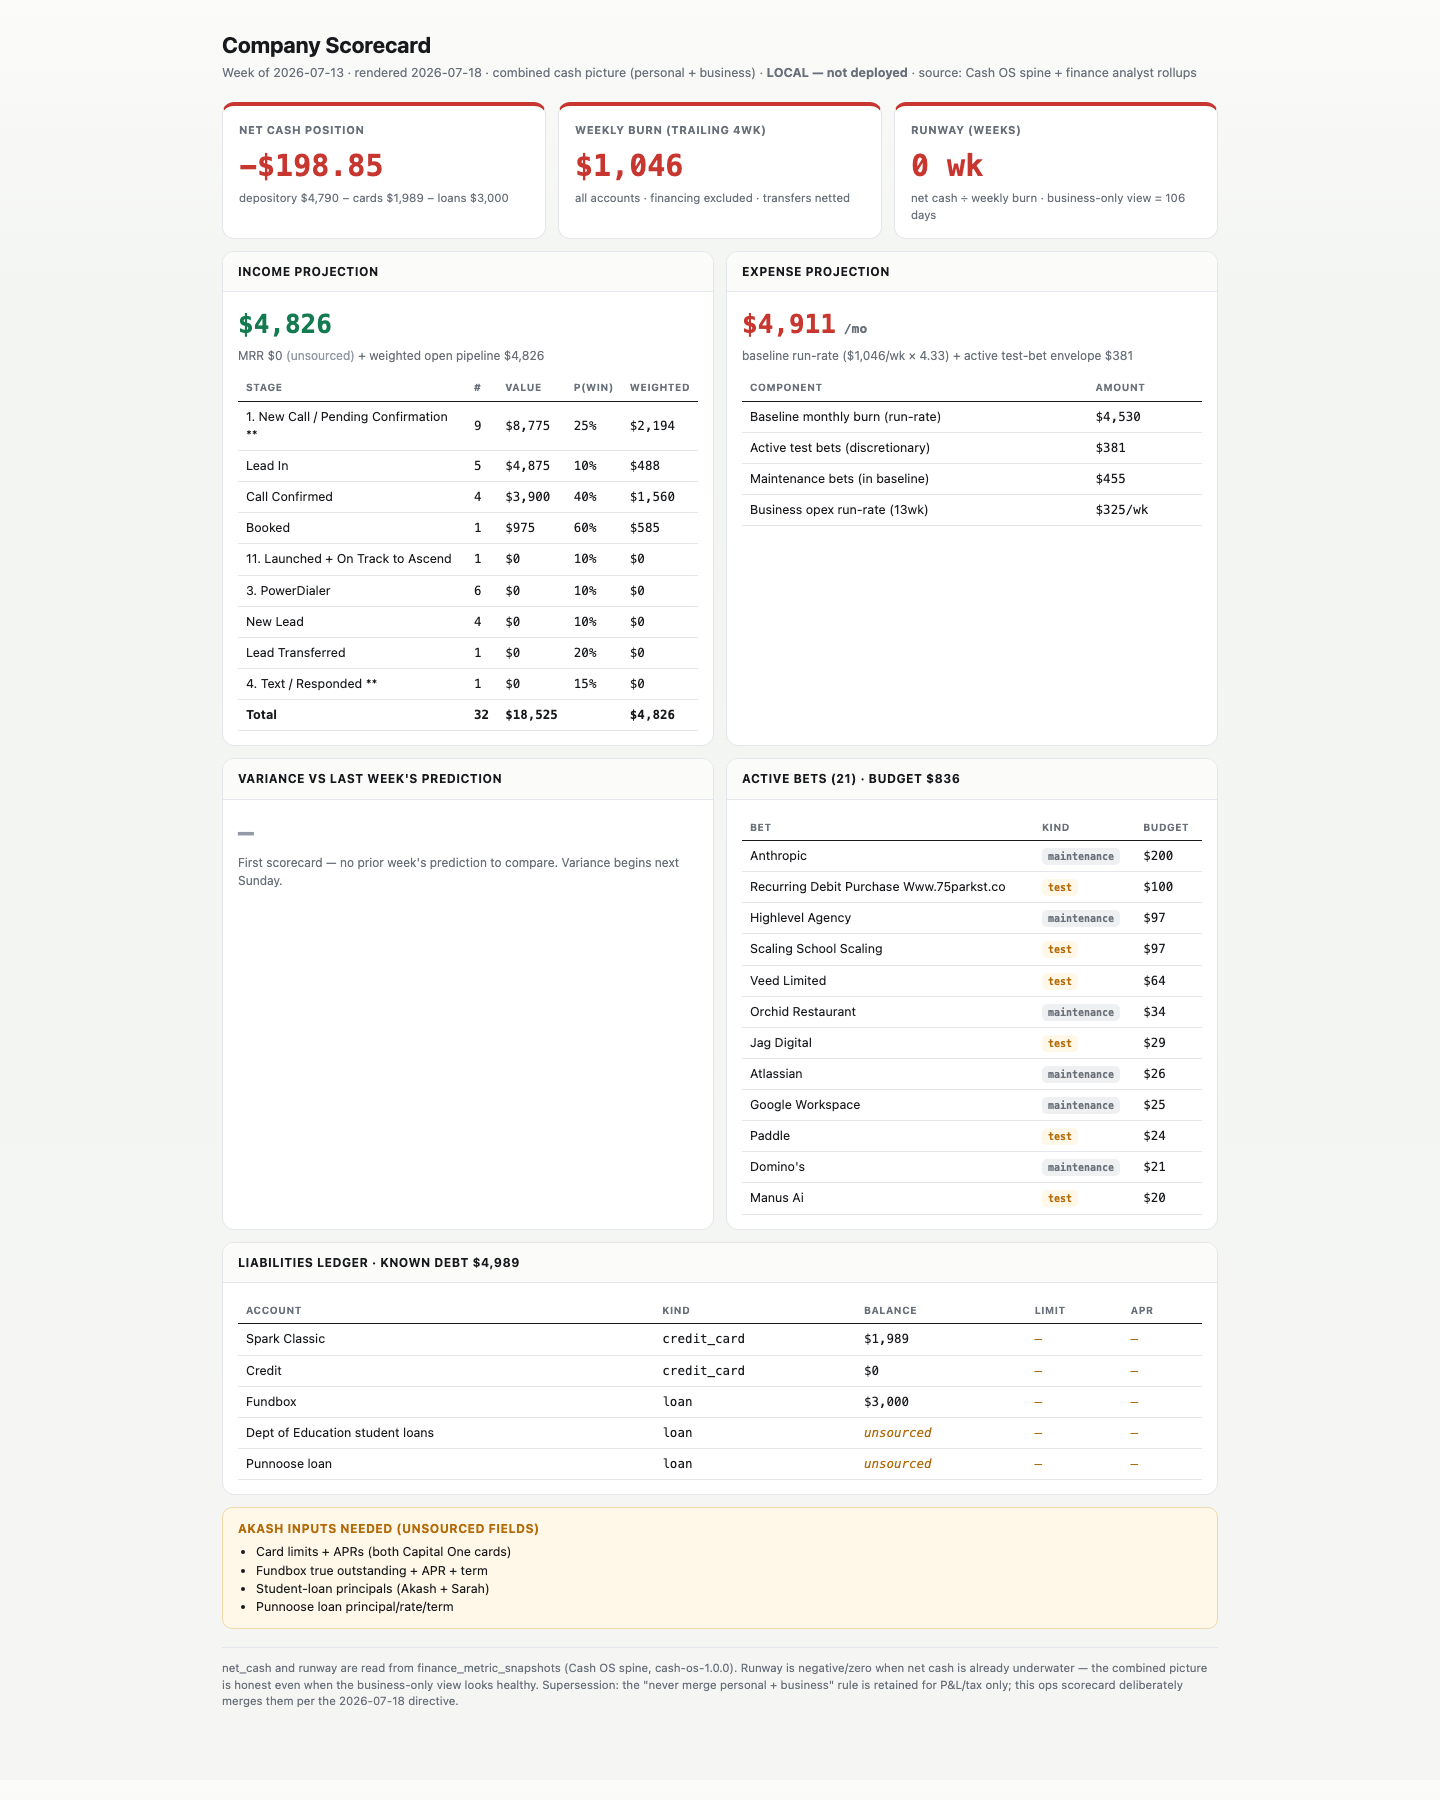
Company Scorecard CONSOLIDATE LOCAL weekly cash review

What it is: a combined personal+business cash snapshot with income/expense projections, active spend bets, and a liabilities ledger. Status: LOCAL, week-of Jul-13, rendered Jul-18, not deployed. When to open: weekly (Sun/Mon) — a weekly review, not a daily cockpit. Hero check: no line graph; opens with three tiles. Variance panel says "First scorecard — variance begins next Sunday." Verdict: CONSOLIDATE → fold income/expense projection, active-bets budget, and liabilities ledger into the room.

Full board
shots/company-scorecard-s01.png
Company scorecard
How to read itTop tiles = combined cash health. Income projection = open pipeline weighted by win-probability. Expense projection = monthly burn (baseline + test bets). Active bets = discretionary spend with test/maintenance tags. Liabilities = known debt by account.
What we see right nowNet cash −$198.85 (depository $4,790 − cards $1,989 − loans $3,000). Weekly burn $1,046, runway 0 wk combined — but the tile also says business-only = 106 days (the two framings disagree loudly). Income projection $4,826 weighted from an $18,525 pipeline of 32 deals (MRR $0/unsourced). Expense projection $4,911/mo. Active bets: 21 items, $836 budget — Anthropic $200 the big one. Liabilities: Spark card $1,989, Fundbox $3,000, plus two unsourced loans.
What to look forRed flag = net cash negative and runway 0wk. Red flag = the business-only (106 days) vs combined (0 wk) gap — decide which one is "the number." Green flag = weighted pipeline > monthly burn ($4,826 vs $4,911 — near breakeven if it converts).
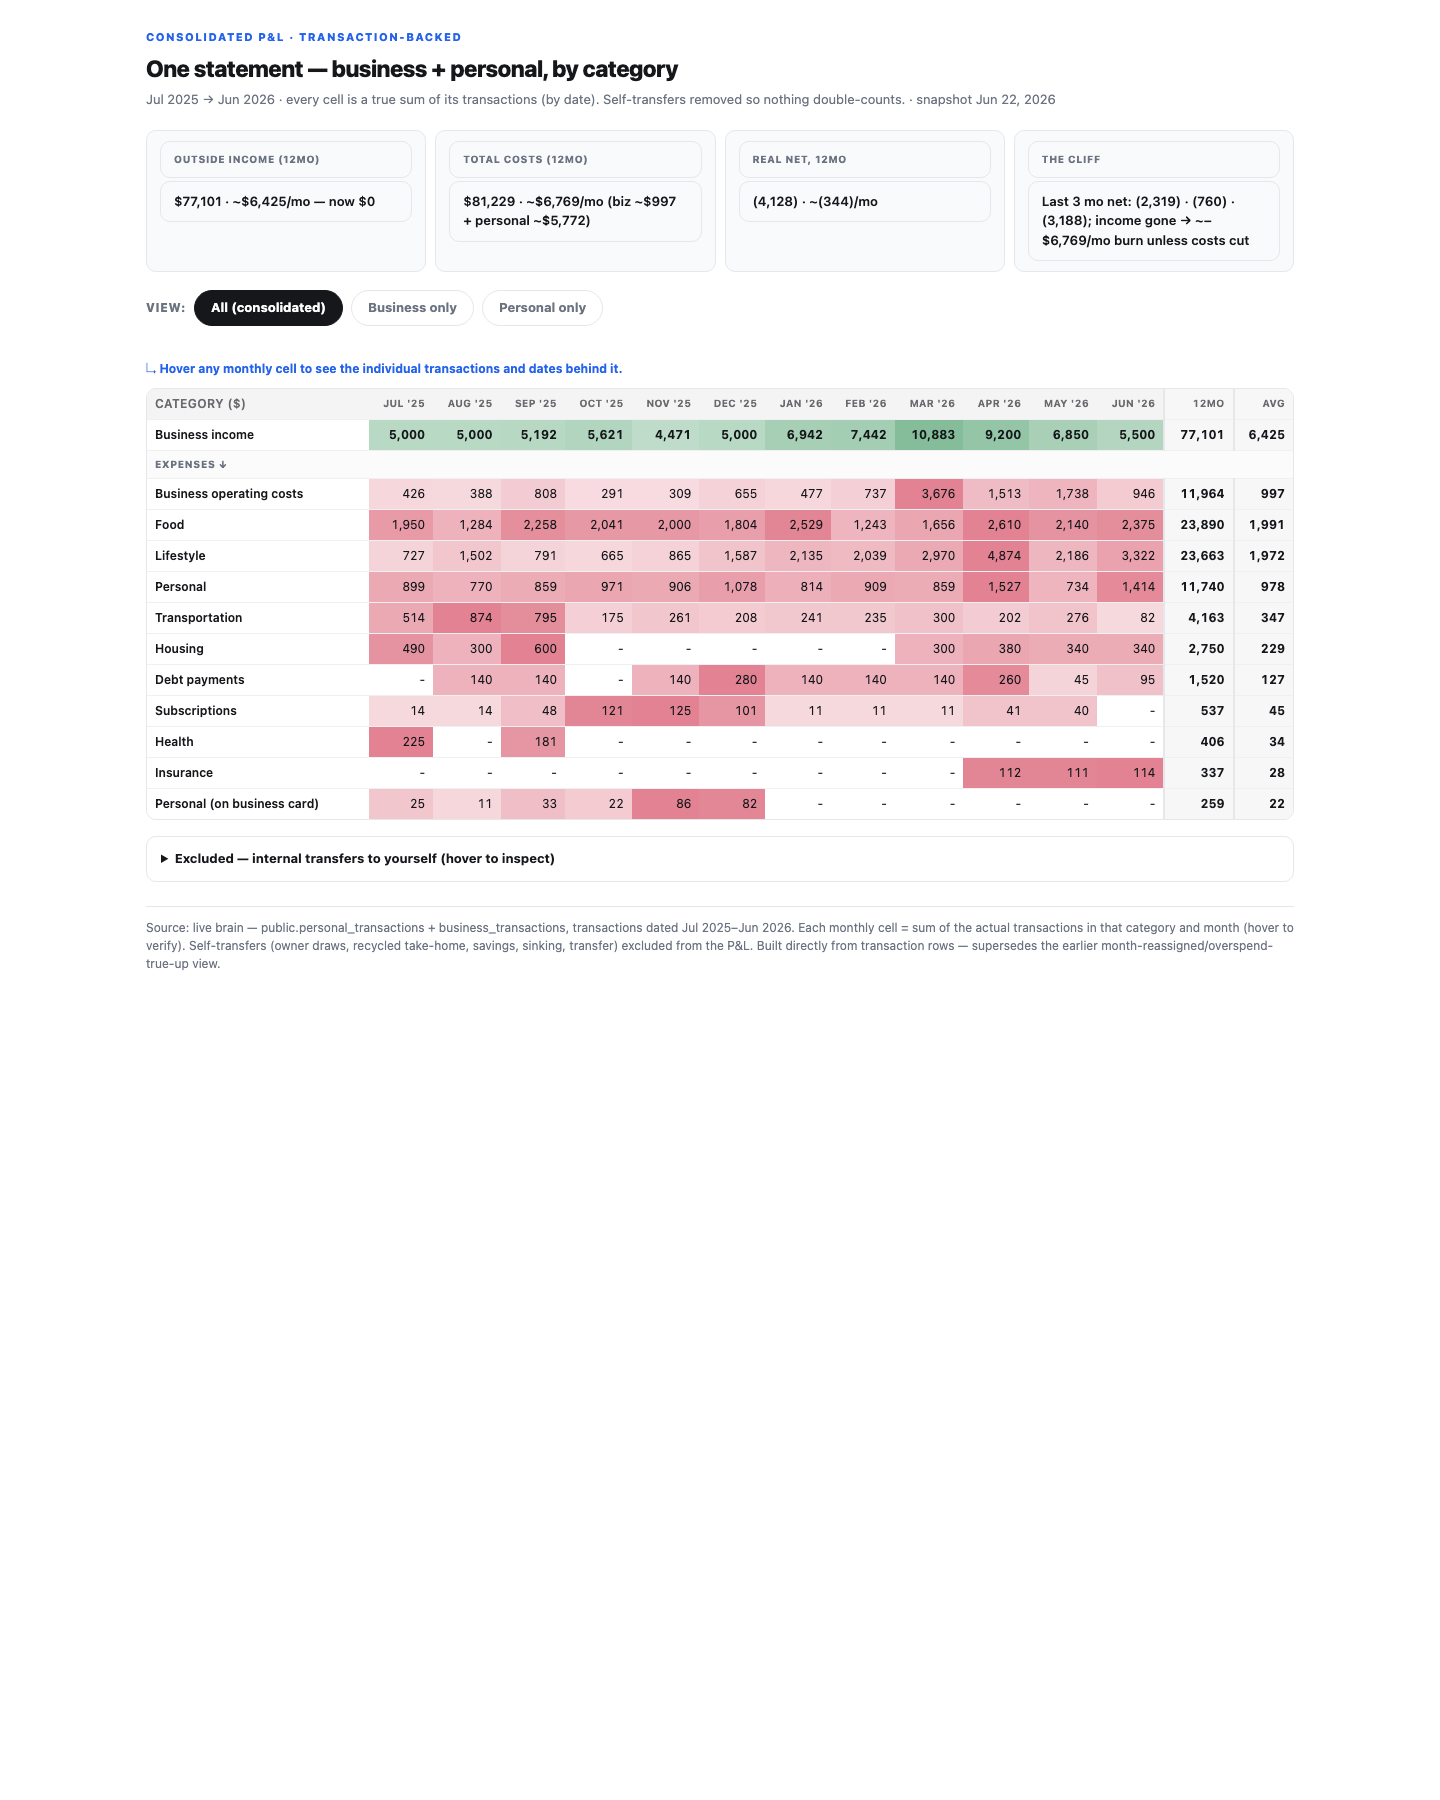
Consolidated P&L CONSOLIDATE LIVE one P&L, business + personal

What it is: one profit-and-loss statement combining business + personal, every cell a true sum of real transactions by category and month. Status: LIVE, but snapshot Jun 22, 2026 — STALE (~4 weeks old). Covers Jul 2025 → Jun 2026. When to open: monthly. Hero check: no line graph — a category×month heatmap. A monthly real-net line would be the right lead. Verdict: CONSOLIDATE → the room's linked P&L drill-down.

Full board
shots/consolidated-pnl-s01.png
Consolidated P&L
How to read itRows = categories (business income up top, then expense categories). Columns = each month + a 12-month total and average. Redder cell = more spend. A view toggle switches All / Business / Personal. Self-transfers removed so nothing double-counts.
What we see right nowOutside income (12mo) $77,101 (~$6,425/mo) — but flagged "now $0" (EyeFly income ended). Total costs $81,229 (~$6,769/mo: biz ~$997 + personal ~$5,772). Real net −$4,128 over 12mo (~−$344/mo). "The Cliff": last 3 months net −$2,319 / −$760 / −$3,188, income gone → ~$6,769/mo burn unless costs cut. Biggest personal: Food $23,890/yr, Lifestyle $23,663/yr.
What to look forRed flag = the snapshot date (Jun 22 — 4 weeks stale; don't trust for a current decision). Red flag = "income gone" against a $6,769/mo cost base. Green flag = a month with positive real net (none in the last 3).
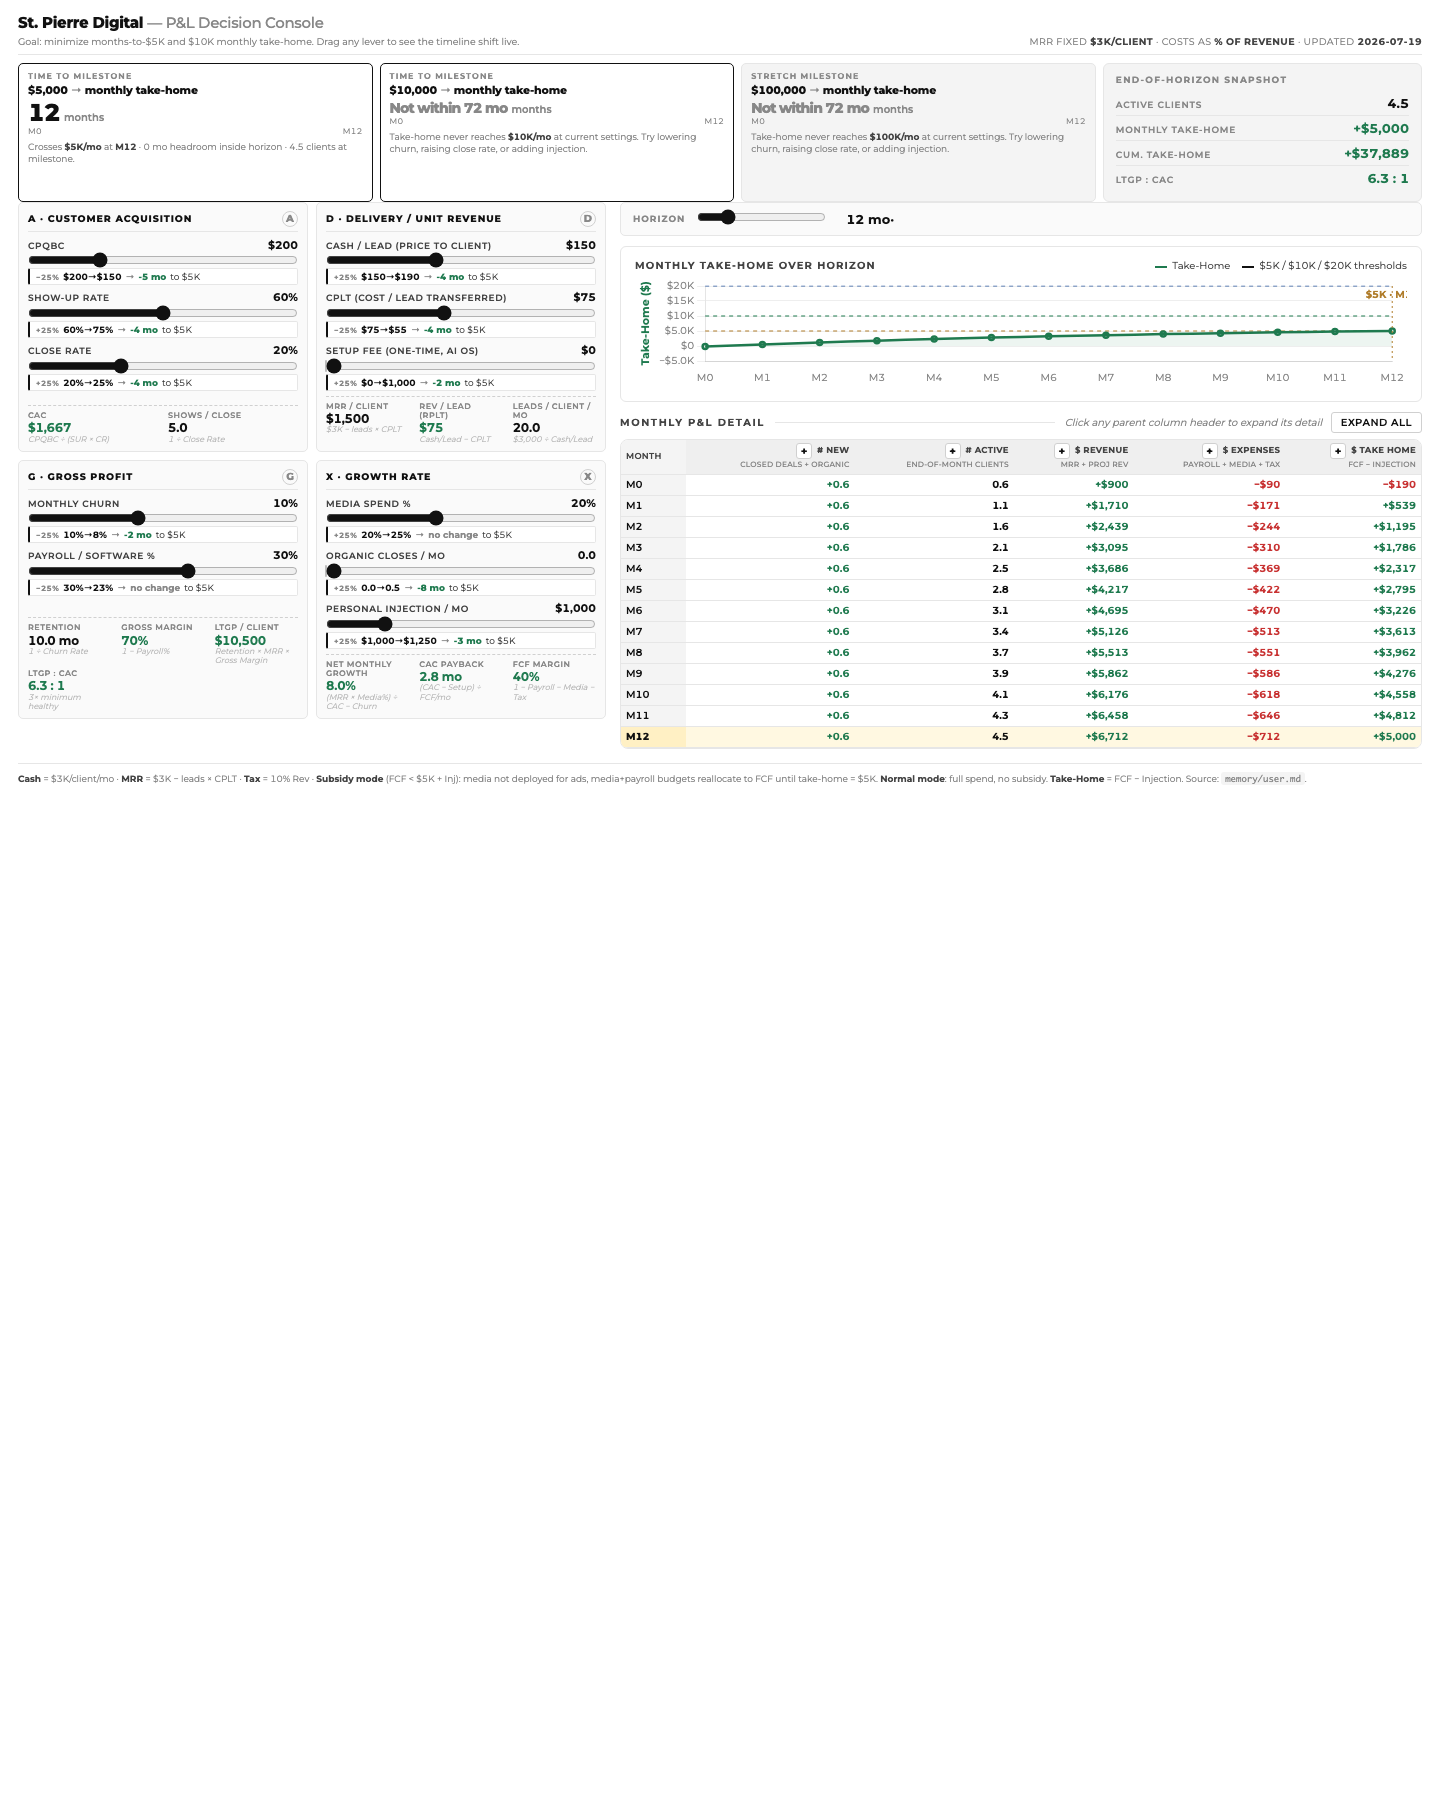
Profit First P&L (Decision Console) RECLASSIFY LIVE a what-if model, not a report

What it is: an interactive what-if tool — drag levers (close rate, churn, media spend, pricing) and watch how many months until $5K/$10K monthly take-home. Status: LIVE, updated 2026-07-19 (fresh). Header reads "St. Pierre Digital" — a banned name to correct to stpierre.ai. When to open: on-trigger, when modeling a decision. Hero check: it has a take-home line graph, but it's a projection console, not a reporting board. Verdict: RECLASSIFY → models/library shelf. Fix the name first.

Full board
shots/profit-first-pnl-s01.png
Profit First P&L
How to read itLeft panels are lever groups (A acquisition, D delivery/unit revenue, G gross profit, X growth). Drag a slider and the milestone tiles + take-home line + monthly P&L recompute live. Top tiles show months-to-$5K / $10K / $100K take-home.
What we see right nowAt current settings, $5K/mo take-home is reached at M12 (12 months, 4.5 clients). $10K and $100K are "not within 72 months." Levers: CPQBC $200, close rate 20%, churn 10%, media spend 20%, personal injection $1,000/mo. End-of-horizon: cumulative take-home +$37,889, LTGP:CAC 6.3:1.
What to look forThis is a model, so "what we see" is a scenario, not reality — treat outputs as directional. Green flag = LTGP:CAC well above 3:1 (6.3:1 is healthy). The concrete fix here is the banned "St. Pierre Digital" name.
Personal Finance DEPRECATE DEAD LINK URL unreachable

What it is: (formerly) a standalone personal-money dashboard. Status: LIVE URL DEADeyefly-personal-finance-dashboard.pages.dev returns DNS_PROBE_FINISHED_NXDOMAIN. The eyefly- prefix is also legacy. Verdict: DEPRECATE — the Cash-OS merge folded personal cash into the room ($1,963.70 context tile), so a separate board is redundant even if it were up.

Unreachable
shots/personal-finance-s01.png — browser error page
Personal finance dead link
What we see right nowA Chrome error page: "This site can't be reached · DNS_PROBE_FINISHED_NXDOMAIN." No data. Either the Cloudflare Pages project was deleted or the DNS record is gone.
What to look forNothing to read — the action is to delist it from the hub.

Confusing bits to fix (the wife test)

  • Runway / cash floor / burn — define on first use in plain words on the tile.
  • DRAFT vs ACTUAL / LOCKED tags — a newcomer won't know the floor is a not-yet-approved placeholder, so the red "BELOW FLOOR" partly reflects a guess. Say so.
  • UNKNOWN striped grey cards look broken — add a legend: "Grey = no data source yet. We show UNKNOWN instead of a fake $0."
  • Acronyms everywhere — MRR, AR, CAC, CPQL/CPQBC, RPL/LTGP, P0, WIG, opex are all undefined on the boards.
  • Two different cash numbers — $2,826 / ~20 days vs −$198.85 / 0 weeks. Pick one framing, label the other.
  • "Sprint / self-bridge / warm-5 / tripwire" — internal jargon; add a tooltip each.
  • "Proxy" and "financing excluded" — explain a proxy is a stand-in, and that loan draws aren't counted as income.
  • "St. Pierre Digital" on the P&L console — banned name; should read stpierre.ai.
  • Dead personal-finance link — delist it; a newcomer just hits a browser error.
  • Stale dates — add a loud "STALE — last updated N days ago" banner when a board is past its refresh window (e.g. consolidated-pnl at 27 days).

5 · 📣 Marketing Room

The room in plain English

This room has one job: turn creative volume into qualified leads at the lowest possible cost. You pour ads in the top (hooks, headlines, formats); what should come out the bottom is qualified leads — real people who fit the foundation & waterproofing niche and are worth a sales call.

The single number that says the machine is working is CPQL — cost per qualified lead = ad spend ÷ qualified leads. Lower is better.

Right now the machine is mostly idling on purpose: 532 ads built and paused, waiting for Akash to flip them live. A tiny canary is actually spending (~$123 total, which bought exactly 1 lead). So today the room is less "watch numbers climb" and more "get the inventory launched cleanly." Strategy is cold direct-offer at broad targeting — the copy does the targeting.

Room KPI recommendation

Core company KPI this room feeds: New MRR — qualified leads are the front of the revenue pipeline; CPQL is the leading cost signal.

  • 1. CPQL (hero)not tracked. Spend lives in sp_ad_metrics_daily (last 07-14), leads in sp_funnel_events (to 07-18), but no join filters "qualified" and divides by spend. Boards show raw CPL ($123.07 for 1 lead), never a qualified cost. This is the room's biggest measurement gap.
  • 2. New ads launched / weektracked (~566/wk), but counts built, not launched-live.
  • 3. Qualified leads / weekpartial. Raw leads captured; no "qualified" flag yet.

Consolidation verdict

DashboardVerdictWhy
Marketing Room hubKEEPThe room index; fix the "$0 / Zero ads serving" tile that contradicts the cockpits.
Ads AutopilotKEEPThe operating cockpit and decision engine; CPQL's natural home.
Creative RadarKEEPRescope to competitor + organic intel; drop the "Our Ads" tab; fix the branding.
Ads Pipeline BoardCONSOLIDATERead-only stuck-inventory list; fold its "oldest offenders" into Ads Autopilot.
Attribution TimelineTOOLA per-lead investigation drill-down, not a glanceable board; tools shelf.
PostHog AcquisitionKEEPAggregate acquisition-source view; complements the per-lead timeline.
Redundancy inside this room: three surfaces list "our ads with spend/impressions/leads" — Creative Radar's Our-Ads tab, Ads Autopilot's packs + what's-running, and the Pipeline Board. Ads Autopilot is richest and should own it; Creative Radar keeps only competitor/organic. Keep both attribution surfaces, but treat the per-lead timeline as an on-demand tool.
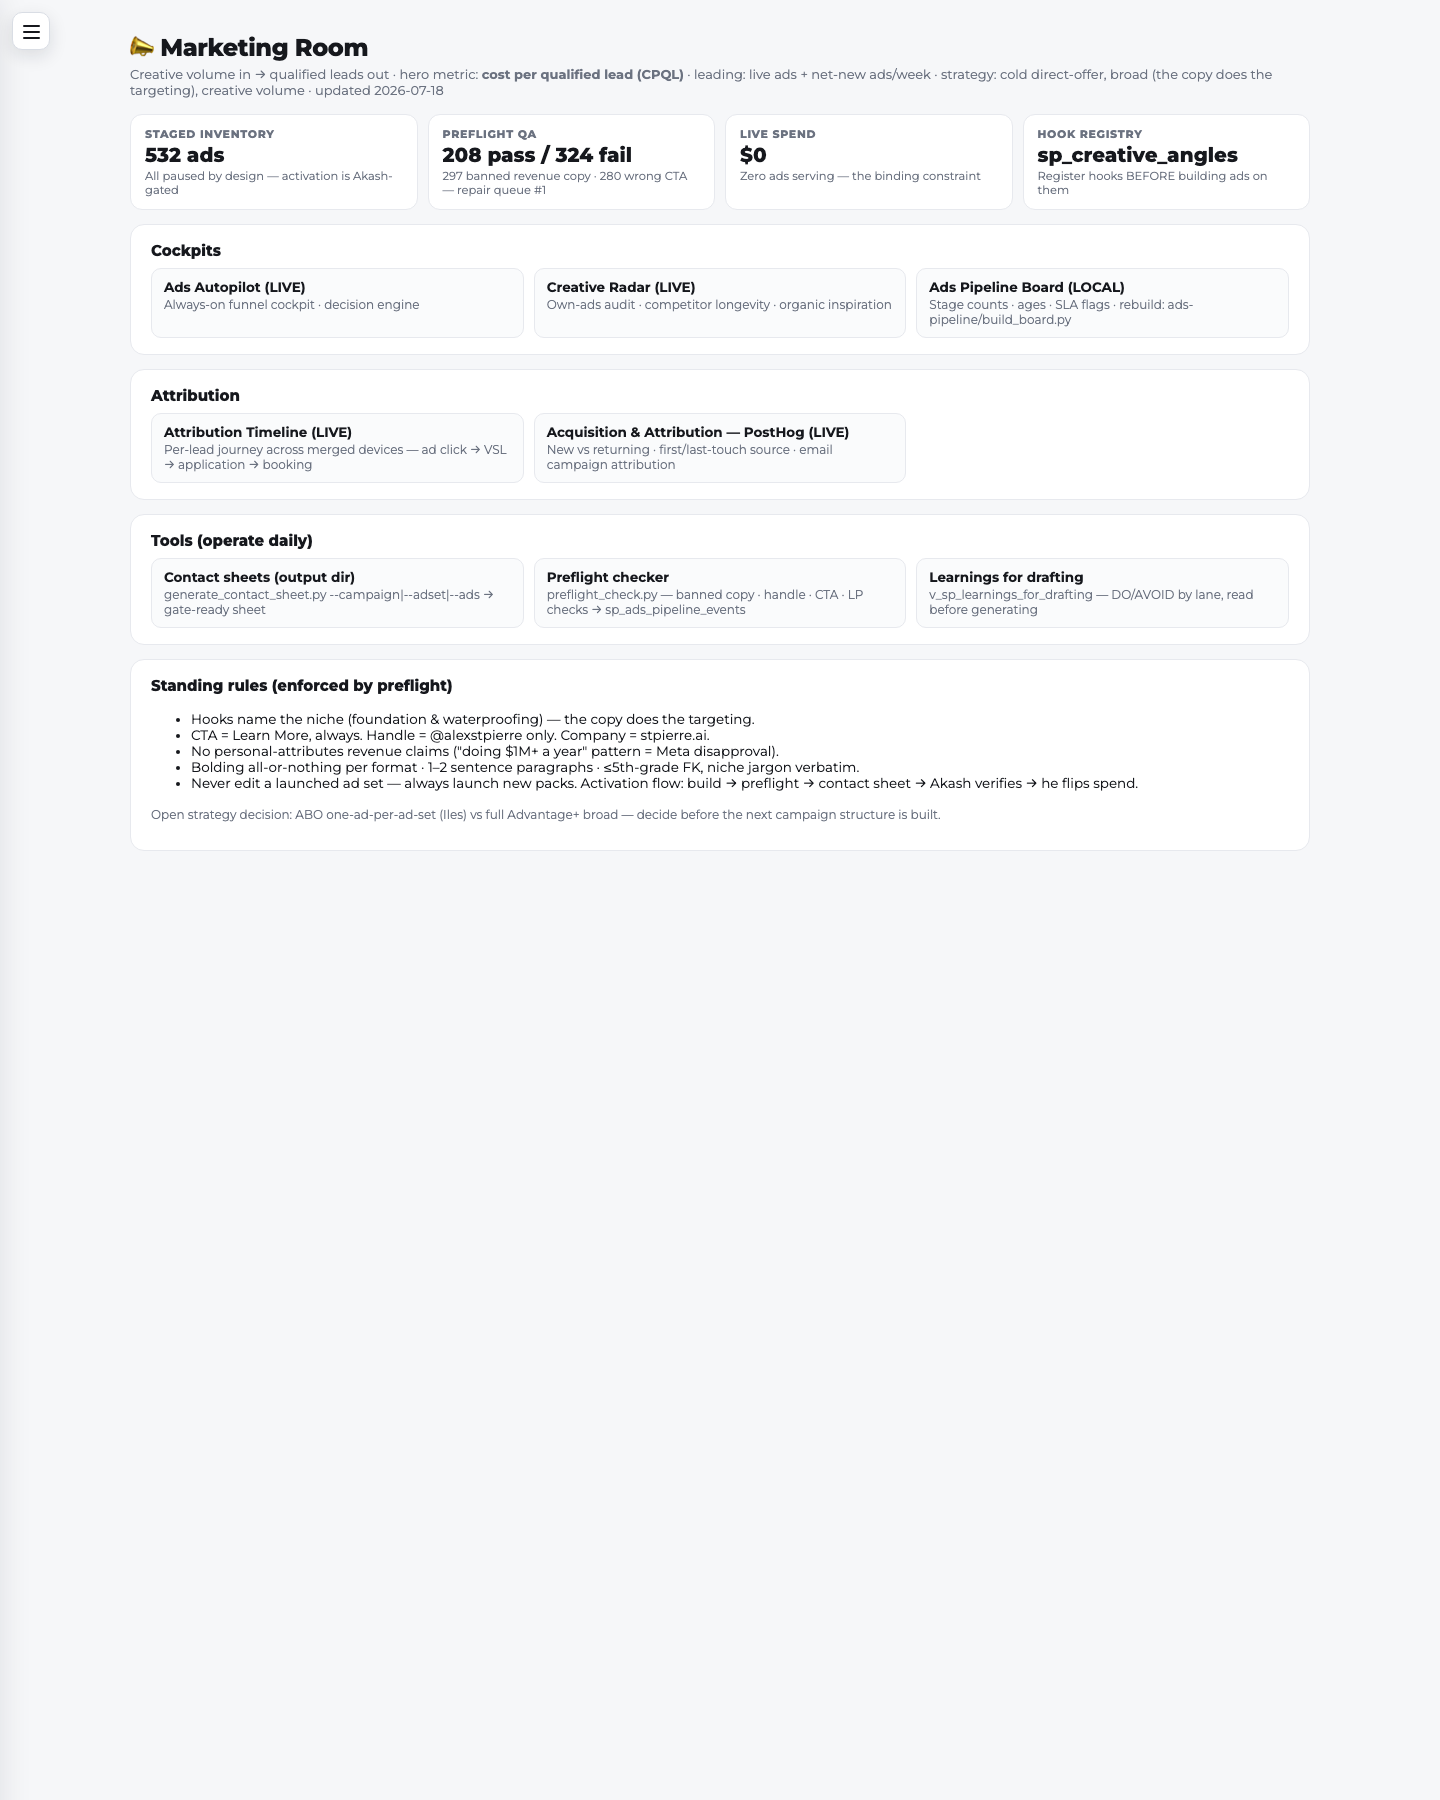
Marketing Room hub KEEP LOCAL the room's front door

What it is: the one-screen index — top-line counts plus links to every cockpit, tool, and rule. Status: LOCAL marketing.html, updated 2026-07-18. When to open: first thing every morning. Hero check: no line graph; four point-in-time tiles. Should trend CPQL, new ads/week, qualified leads/week. Verdict: KEEP — fix the misleading spend tile.

Header + top tiles + cockpit links
shots/marketing-room-s01.png
Marketing room hub
How to read itThe subtitle states the thesis ("Creative volume in → qualified leads out · hero: CPQL"). Four tiles: Staged Inventory, Preflight QA, Live Spend, Hook Registry. Below, grouped link-blocks (Cockpits, Attribution, Tools) and the standing rules.
What we see right now532 ads staged ("all paused by design"). Preflight QA 208 pass / 324 fail (297 banned revenue copy · 280 wrong CTA = repair queue #1). Live Spend shows $0 "Zero ads serving." This tile is wrong/stale — the cockpits show $123.07 spend, 2,731 impressions, 1 lead, and 111 live ads. Standing rules are correct and current (hooks name the niche, CTA = Learn More, handle = @alexstpierre, company = stpierre.ai, all-or-nothing bolding, never edit a launched ad set). Open decision flagged: ABO one-ad-per-ad-set vs full Advantage+ broad.
What to look forGreen flag = pass count climbing as the repair queue clears. Red flag = fail count (324) staying high. Red flag = the "$0 / zero serving" claim persisting — the tile isn't reading live data. Action: wire Live Spend to the source Ads Autopilot uses; resolve the ABO-vs-Advantage+ decision before more inventory is built.
Ads Autopilot KEEP LIVE the always-on funnel cockpit

What it is: shows staged inventory, the overnight decision engine's verdicts, live-pack performance, every running ad's thumbnail, and the test roadmap. Status: LIVE, decision snapshot 2026-07-18 (07:30 ET, "122 · 2026-07-18"). When to open: every morning after the hub. Hero check: no line graph; leads with the staged-inventory table + a verdict tile row. Should be a CPQL line + daily live-ad count. Verdict: KEEP — home of the CPQL hero graph; absorb the pipeline-board's stuck-inventory signal.

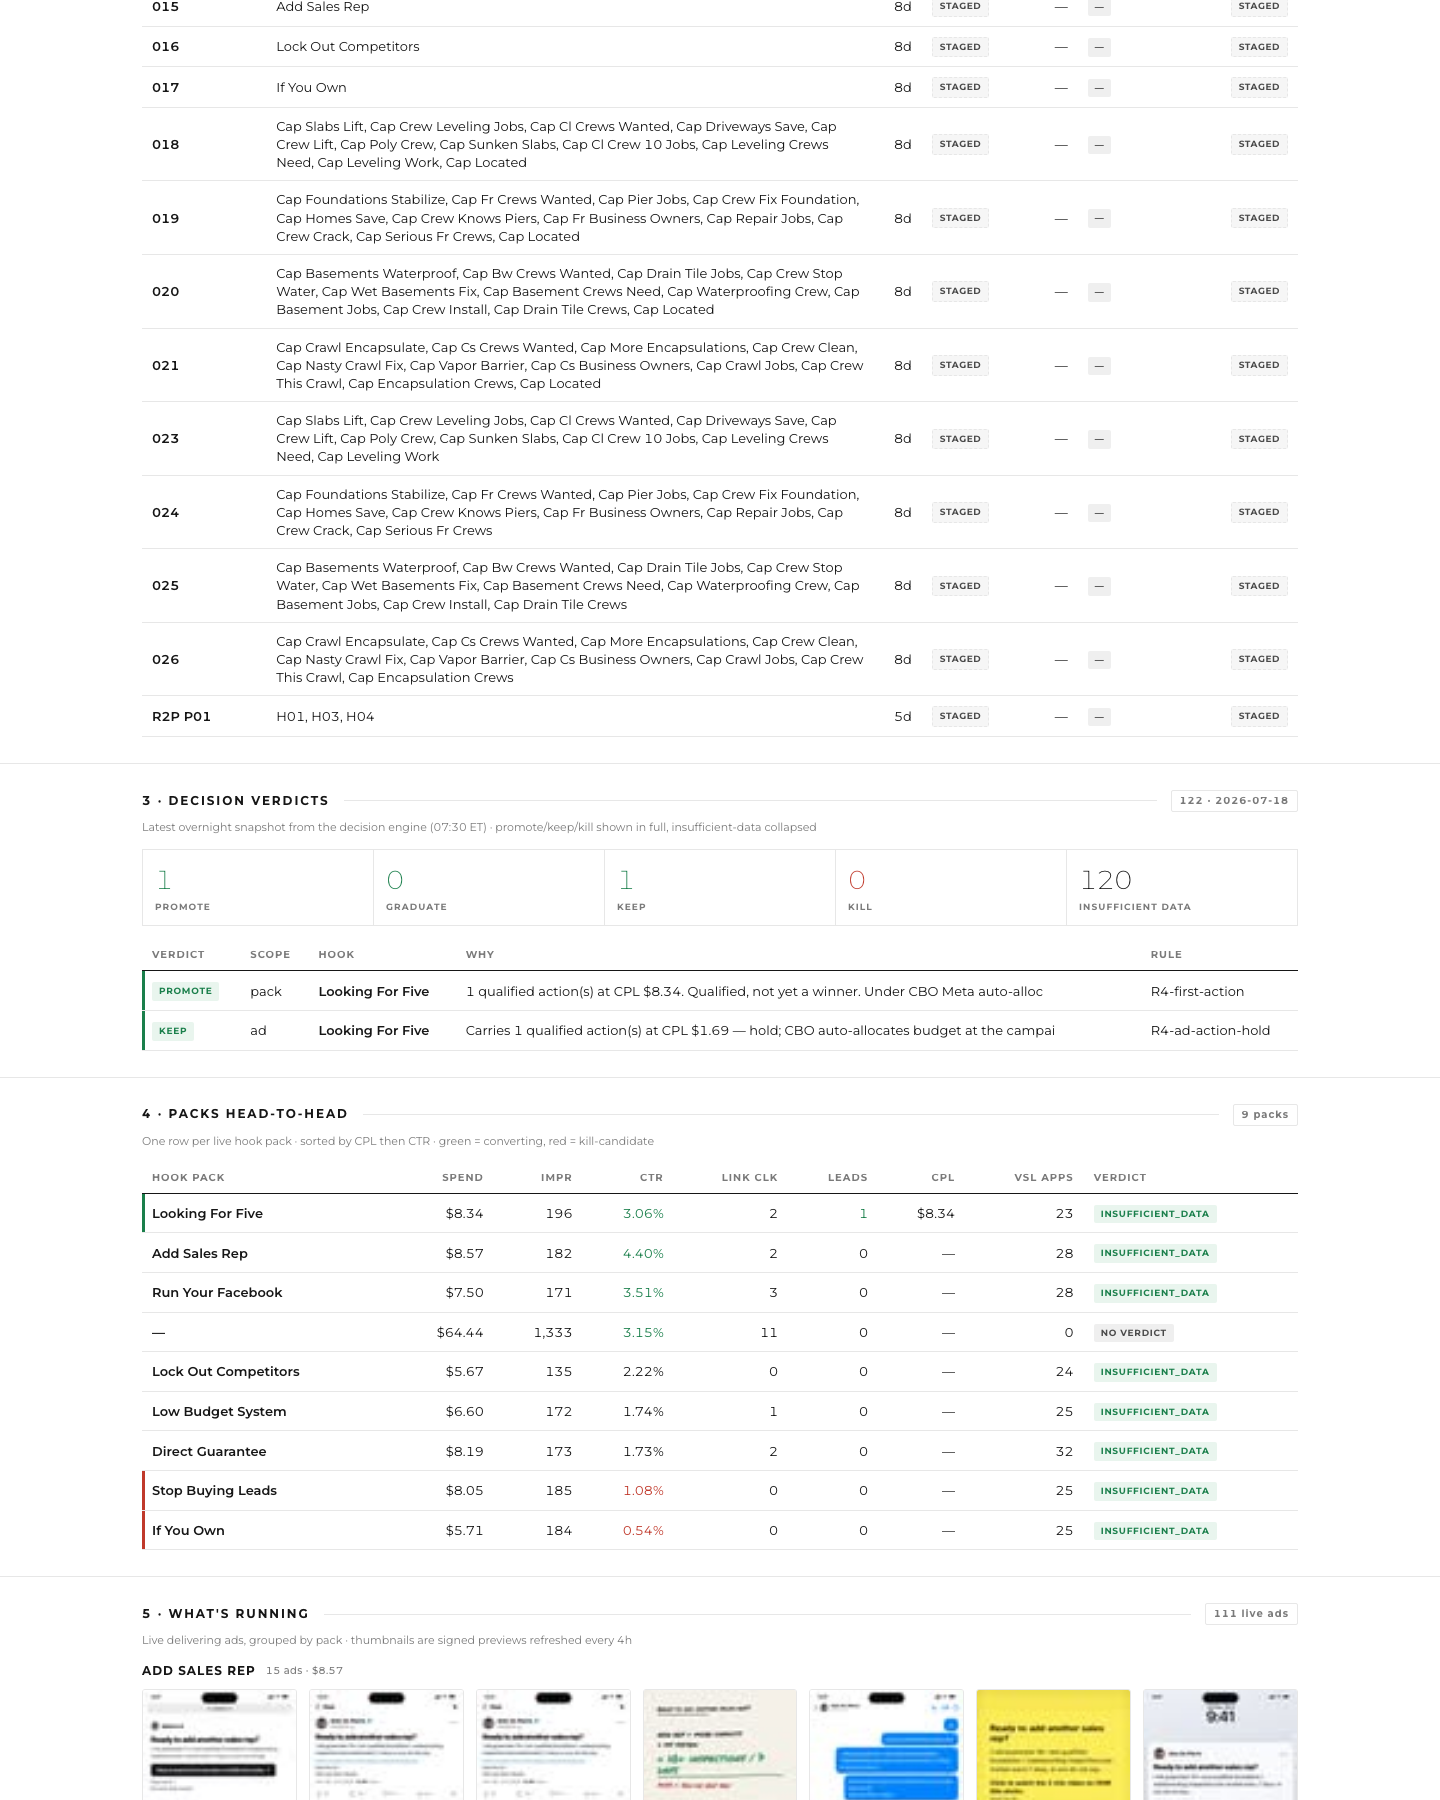
Staged inventory + decision verdicts
shots/ads-autopilot-s01.png — staged inventory, verdicts, packs head-to-head
Ads autopilot verdicts
How to read itThe upper table lists staged ad packs (all STAGED, aged ~8d). "Decision Verdicts" is the overnight engine's call: counts across Promote / Graduate / Keep / Kill / Insufficient-data, then reasoned rows.
What we see right nowVerdicts: 1 Promote, 0 Graduate, 1 Keep, 0 Kill, 120 Insufficient-data. The Promote is the "Looking For Five" pack ("1 qualified action at CPL $8.34"). The Keep is the same ad at CPL $1.69, held because Meta's CBO auto-allocates budget. 120 of 122 items just don't have enough data yet — expected at this tiny spend.
What to look forGreen flag = anything reaching Promote/Graduate with a real CPQL. Red flag = a Kill (an ad burning money with no leads). Red flag = Insufficient-data staying near-total for weeks (spend too low to learn). Action: the lone qualified lead ($8.34 CPL) is the only real signal in the room — protect that pack.
Packs head-to-head
How to read itOne row per live hook pack, sorted by CPL then CTR (click-through rate = clicks ÷ impressions). Green = converting, red = kill-candidate.
What we see right now"Looking For Five" leads: $8.34 spend, 196 impressions, 3.06% CTR, 2 clicks, 1 lead, $8.34 CPL, 23 VSL apps. Every other pack shows 0 leads: Add Sales Rep ($8.57, 4.40% CTR, 28 apps), Run Your Facebook ($7.50), Lock Out Competitors ($5.67), Low Budget System ($6.60), Direct Guarantee ($8.19). Two flagged red for weak CTR: Stop Buying Leads (1.08%), If You Own (0.54%). An unlabeled row shows $64.44 / 1,333 impressions / 11 clicks / 0 leads / "NO VERDICT" — the bulk of spend with nothing to show.
What to look forGreen flag = a pack crossing into multiple leads at low CPL. Red flag = the red-CTR packs (If You Own at 0.54%). Red flag = the $64.44 unlabeled "NO VERDICT" row eating half the account's spend. Action: identify and fix or pause that spend sink.
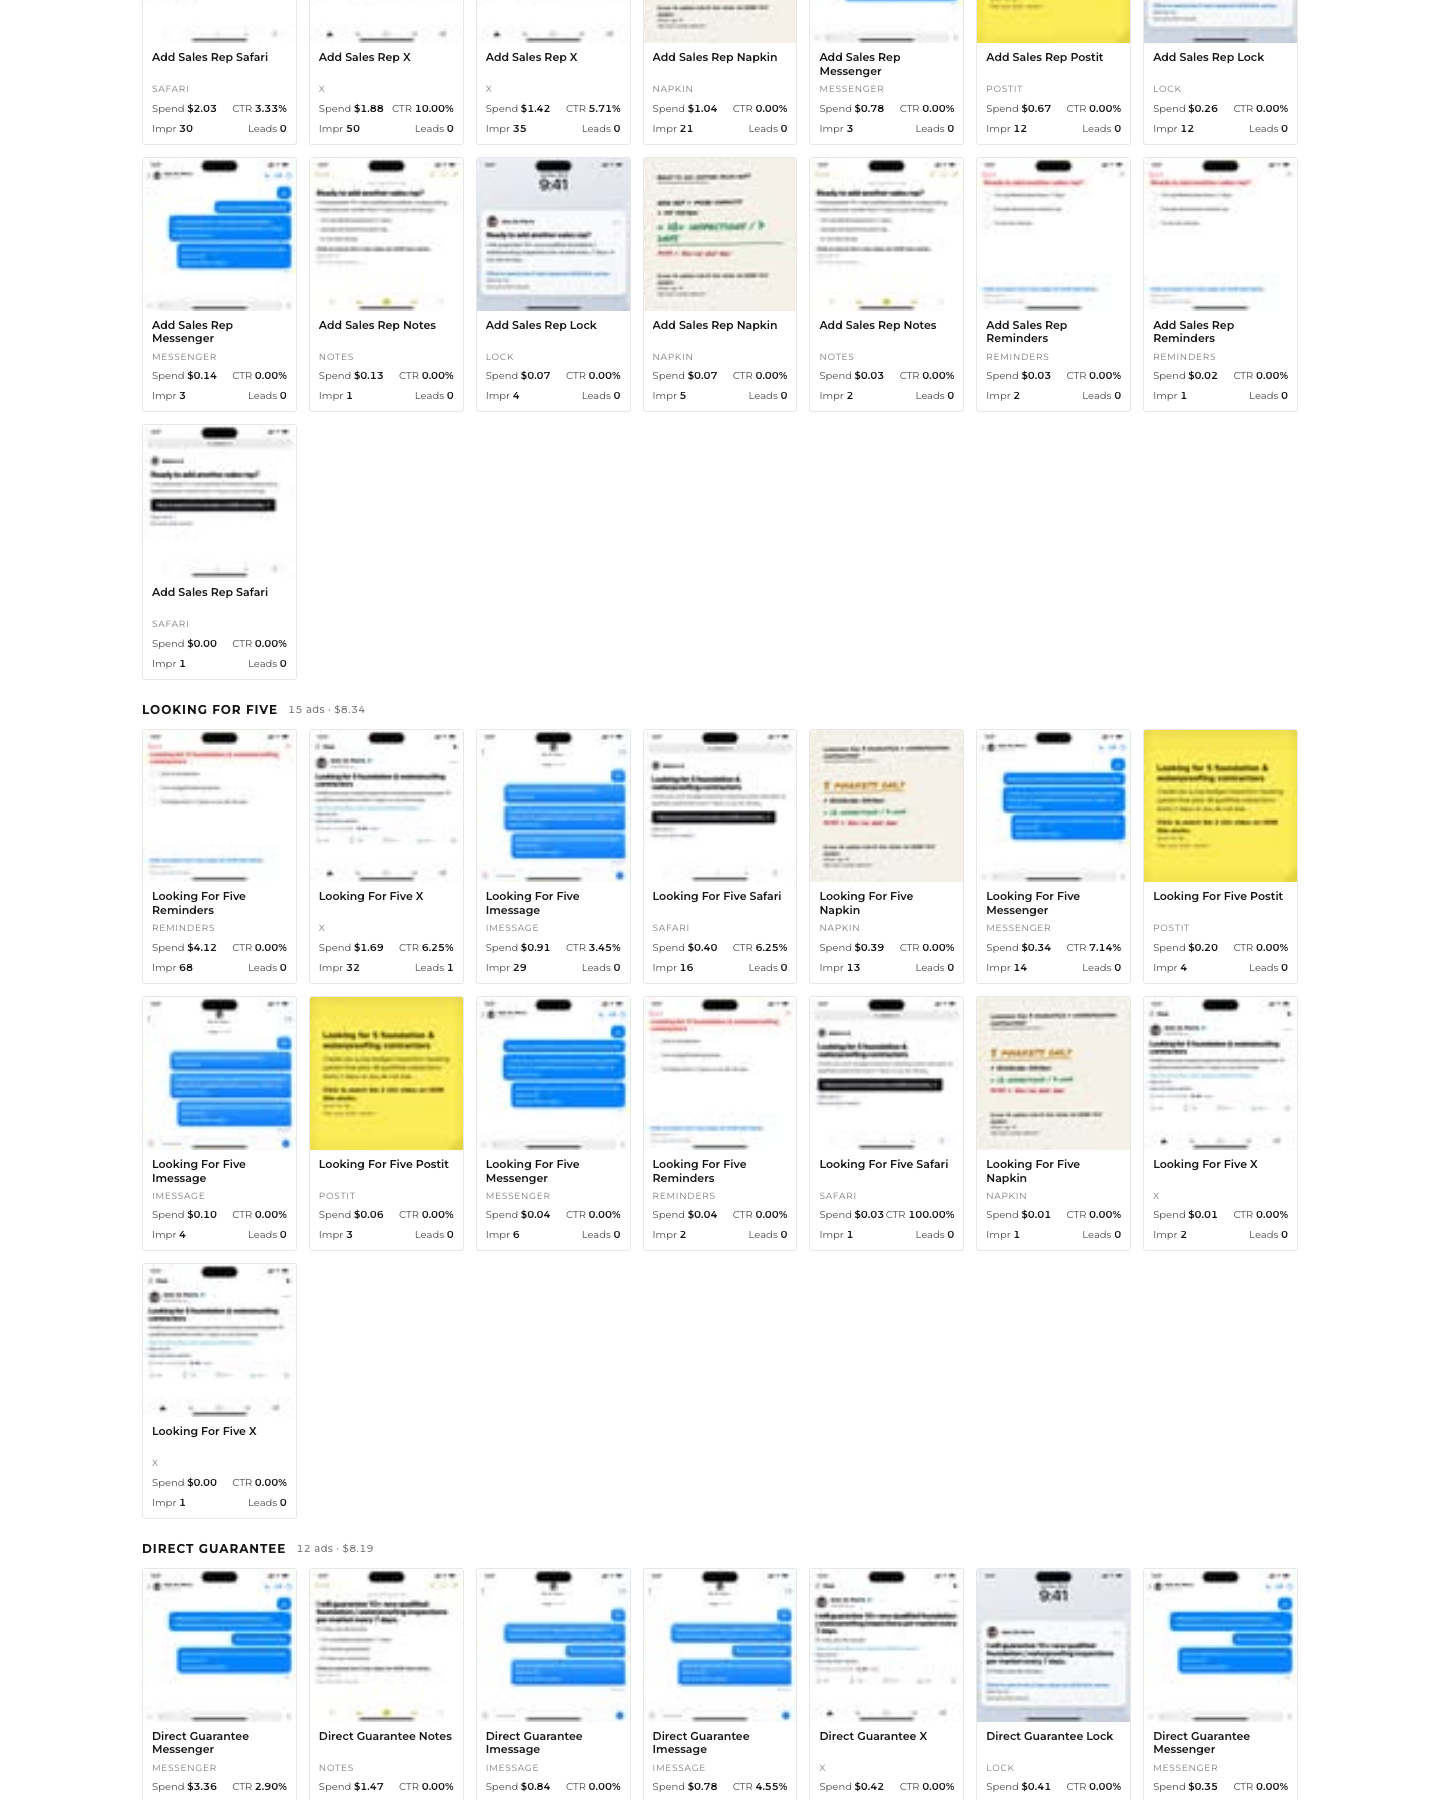
What's running (thumbnails)
shots/ads-autopilot-s02.png — live ads by pack
Ads autopilot running s02
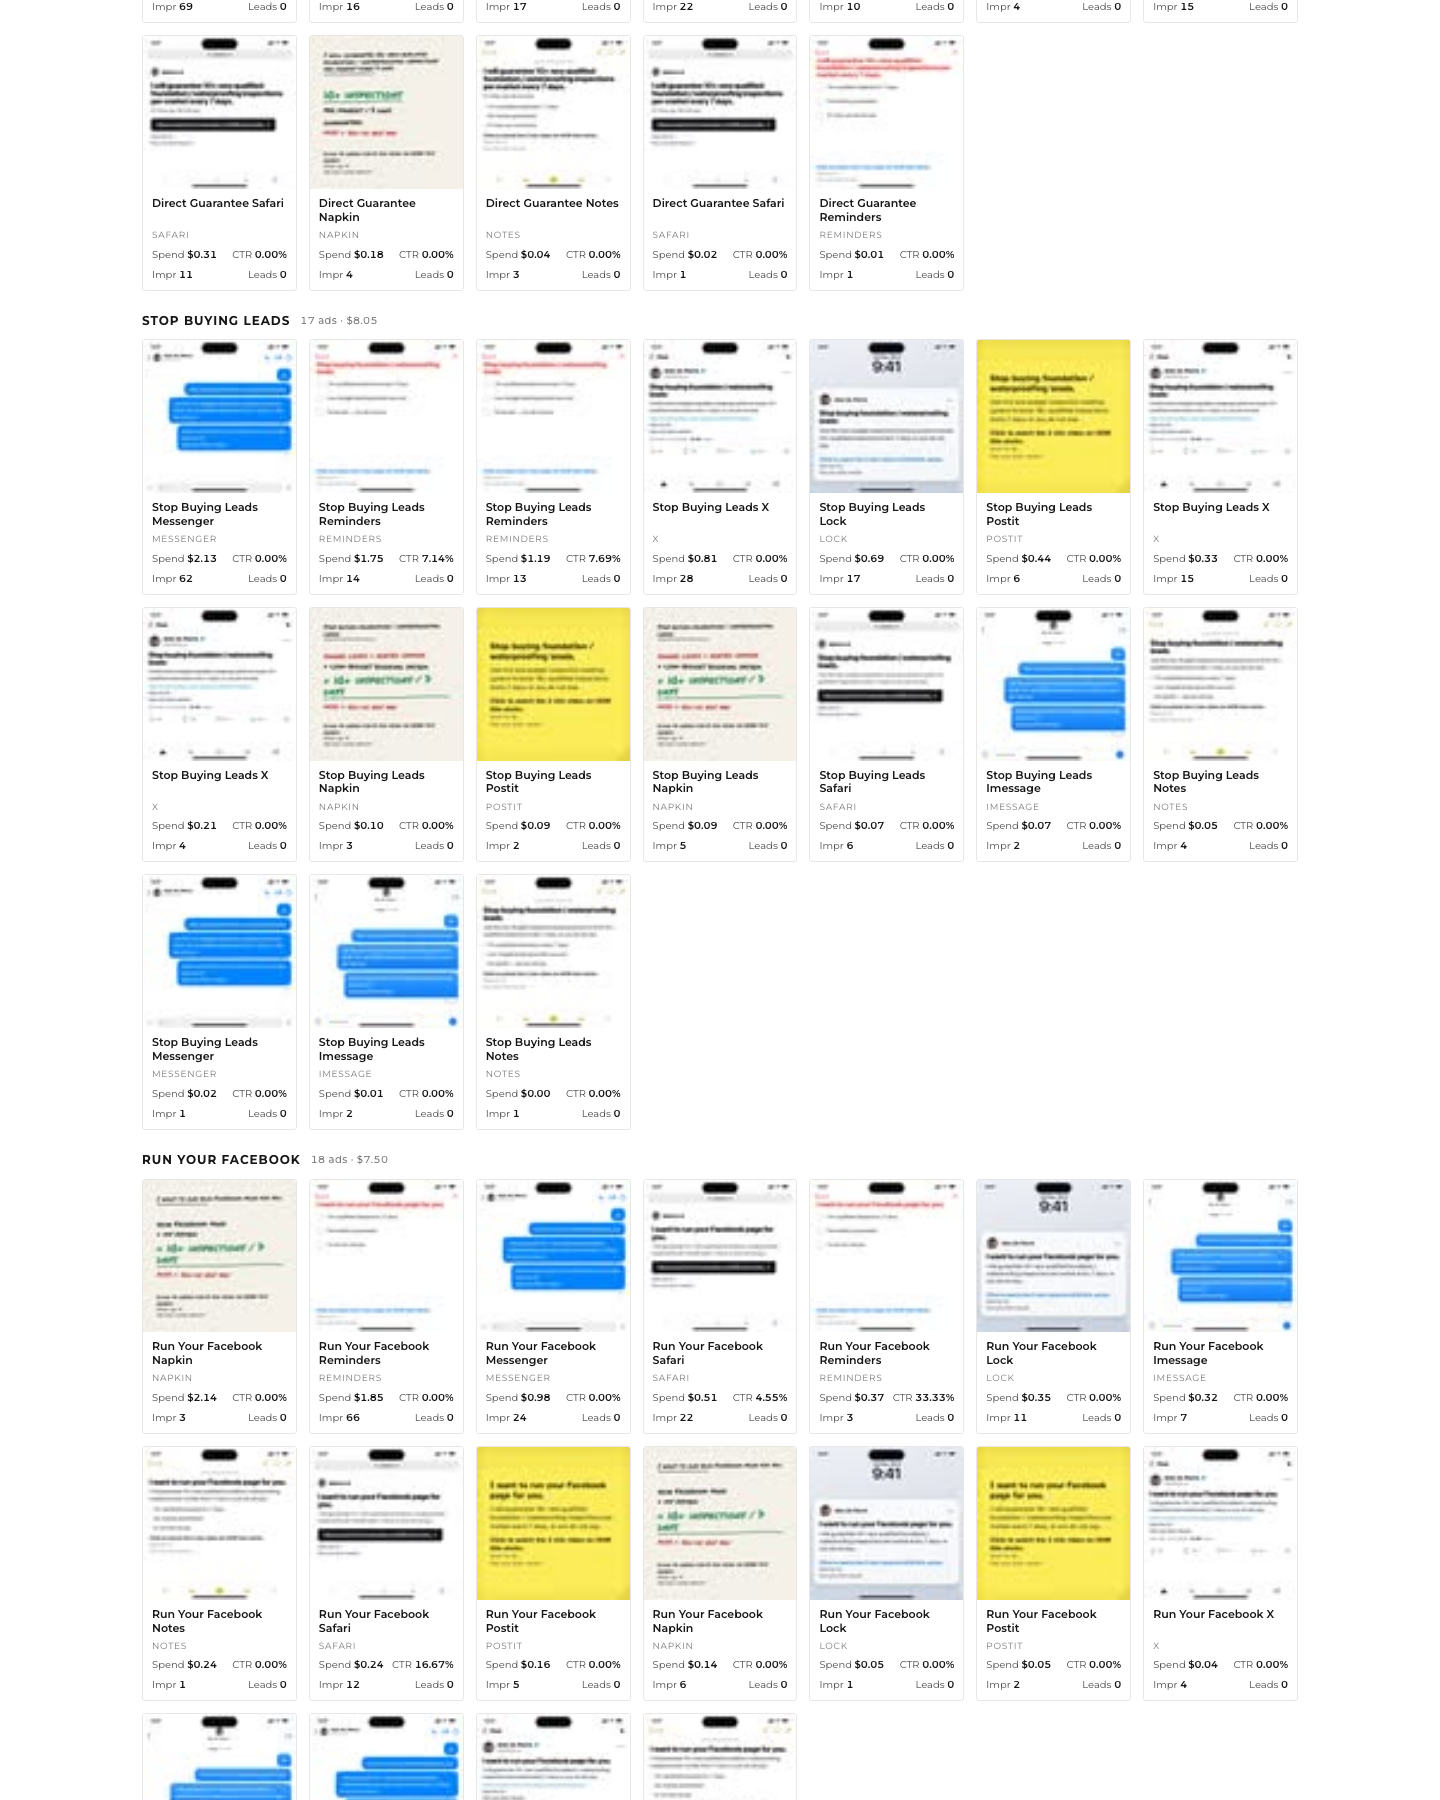
shots/ads-autopilot-s03.png
Ads autopilot running s03
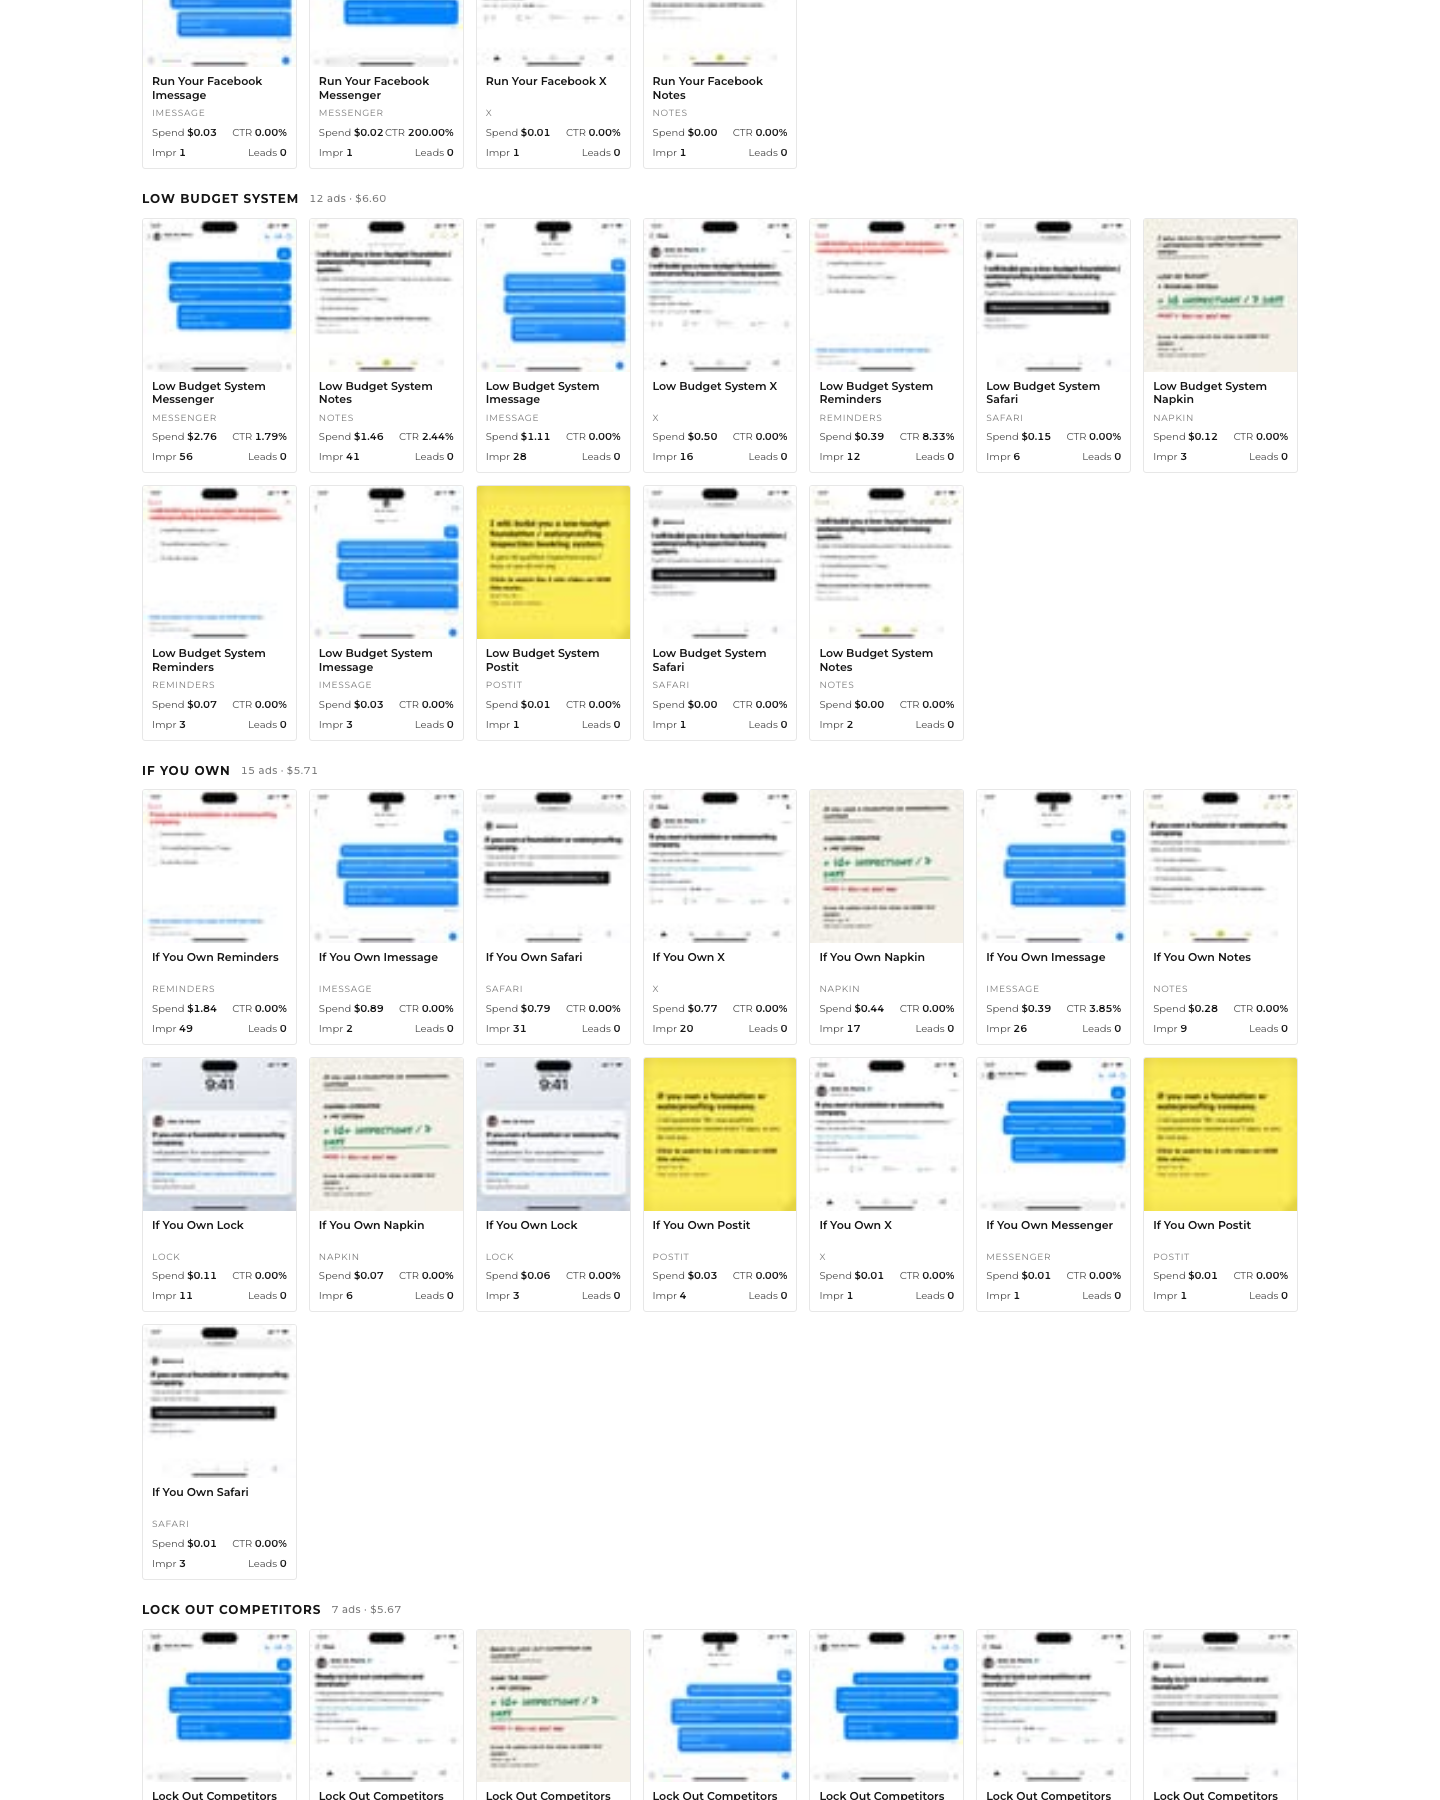
shots/ads-autopilot-s04.png
Ads autopilot running s04
How to read itLive ads grouped by pack, each with a signed preview thumbnail (refreshed every 4h) plus spend / CTR / impressions / leads. Format suffixes (Messenger, Notes, Lock, Postit, Napkin, iMessage, Safari, X) are the visual template used.
What we see right now111 live ads across packs (Add Sales Rep 15 · Looking For Five 15 · Direct Guarantee 12 · Stop Buying Leads 17 · Run Your Facebook 18 · Low Budget System 12 · If You Own 15 · Lock Out Competitors 7). Almost every ad shows 0 leads and mostly 0.00% CTR at single-digit impressions — spend spread thinly ($0.01–$4.29/ad). A few show life: Add Sales Rep X 10.00% CTR (50 impr), Looking For Five Postit and Safari 6.25% CTR.
What to look forGreen flag = a specific format consistently out-clicking others (scale it). Red flag = dozens of ads at 1–4 impressions (too fragmented to learn). Action: consolidate spend onto fewer bets to reach significance.
Staged variants, decision queue, caption lanes, destination axis
shots/ads-autopilot-s05.png
Ads autopilot staged variants
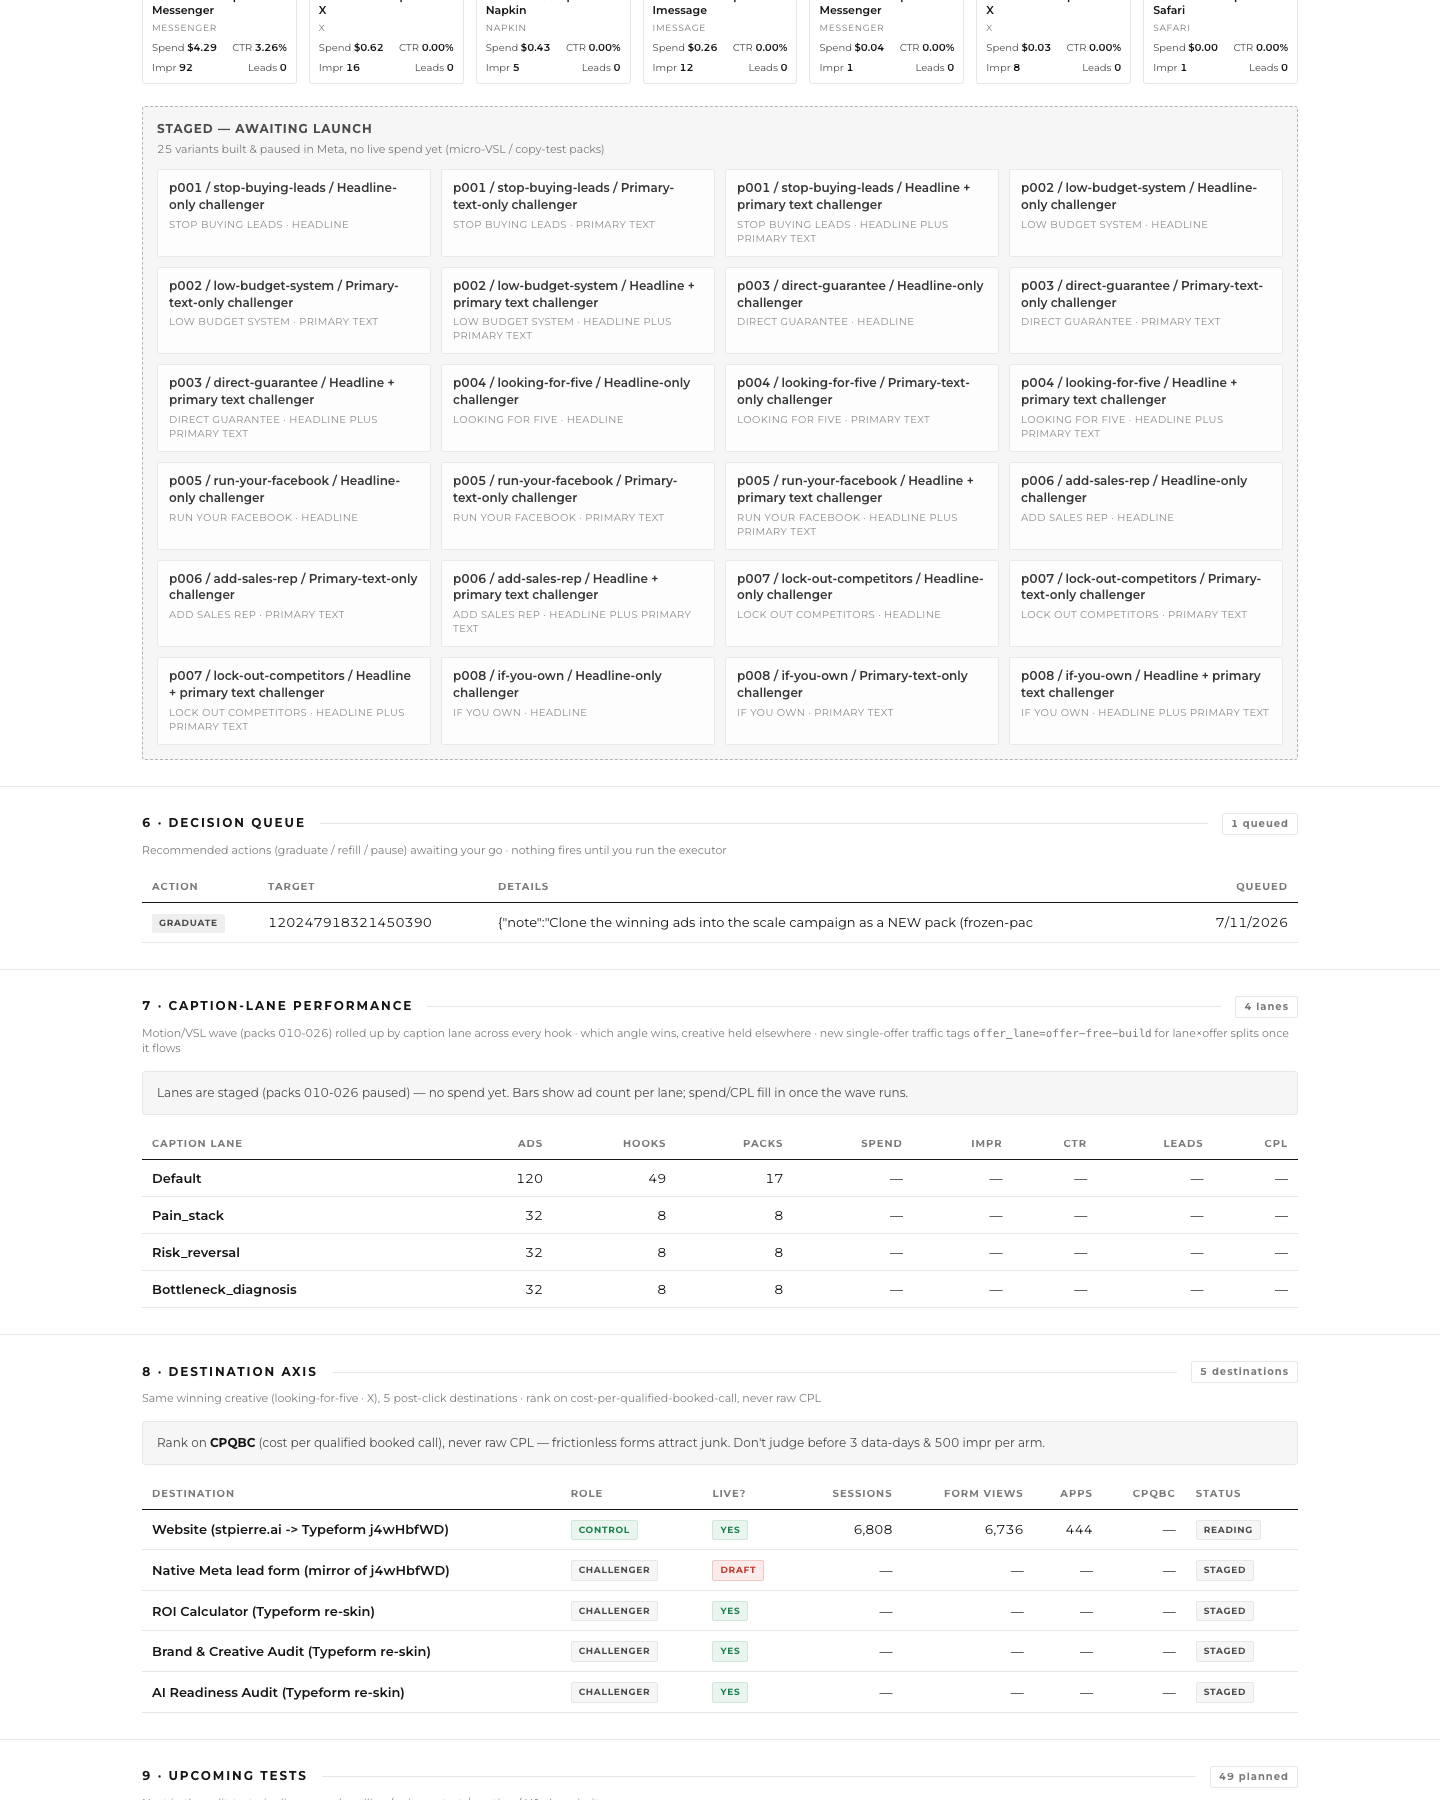
How to read it"Staged — awaiting launch" lists 25 built-and-paused micro-VSL / copy-test variants. The Decision Queue holds actions that only fire when Akash runs the executor. Caption-lane and destination-axis tables compare angles and post-click destinations.
What we see right now1 action queued — a "GRADUATE" recommendation on campaign 120247918321450390 ("Clone the winning ads into the scale campaign"), queued 7/11 (8 days old, not run). Caption lanes all staged, no spend. Destination axis ranks 5 destinations on CPQBC: only Website→Typeform j4wHbfWD is live (6,808 sessions, 6,736 form views, 444 apps); others live-staged; native Meta lead form is DRAFT.
What to look forGreen flag = the queued GRADUATE executing once a real winner exists. Red flag = a graduate recommendation sitting 8 days unactioned. Red flag = 444 applications against 6,736 form views but only 1 confirmed qualified lead — the qualified-lead join is missing. Action: define "qualified" and wire CPQBC.
Creative Radar KEEP LIVE creative-intelligence layer

What it is: judges your own ads, tracks competitor ad longevity, and mines organic content for inspiration. Status: LIVE, "Live · Jul 18, 11:34 AM." When to open: weekly, planning the next batch. Hero check: no line graph; four tiles. Should trend link-CTR + leads for top packs. Verdict: KEEP but rescope to competitor/organic; drop "Our Ads" tab; fix branding.

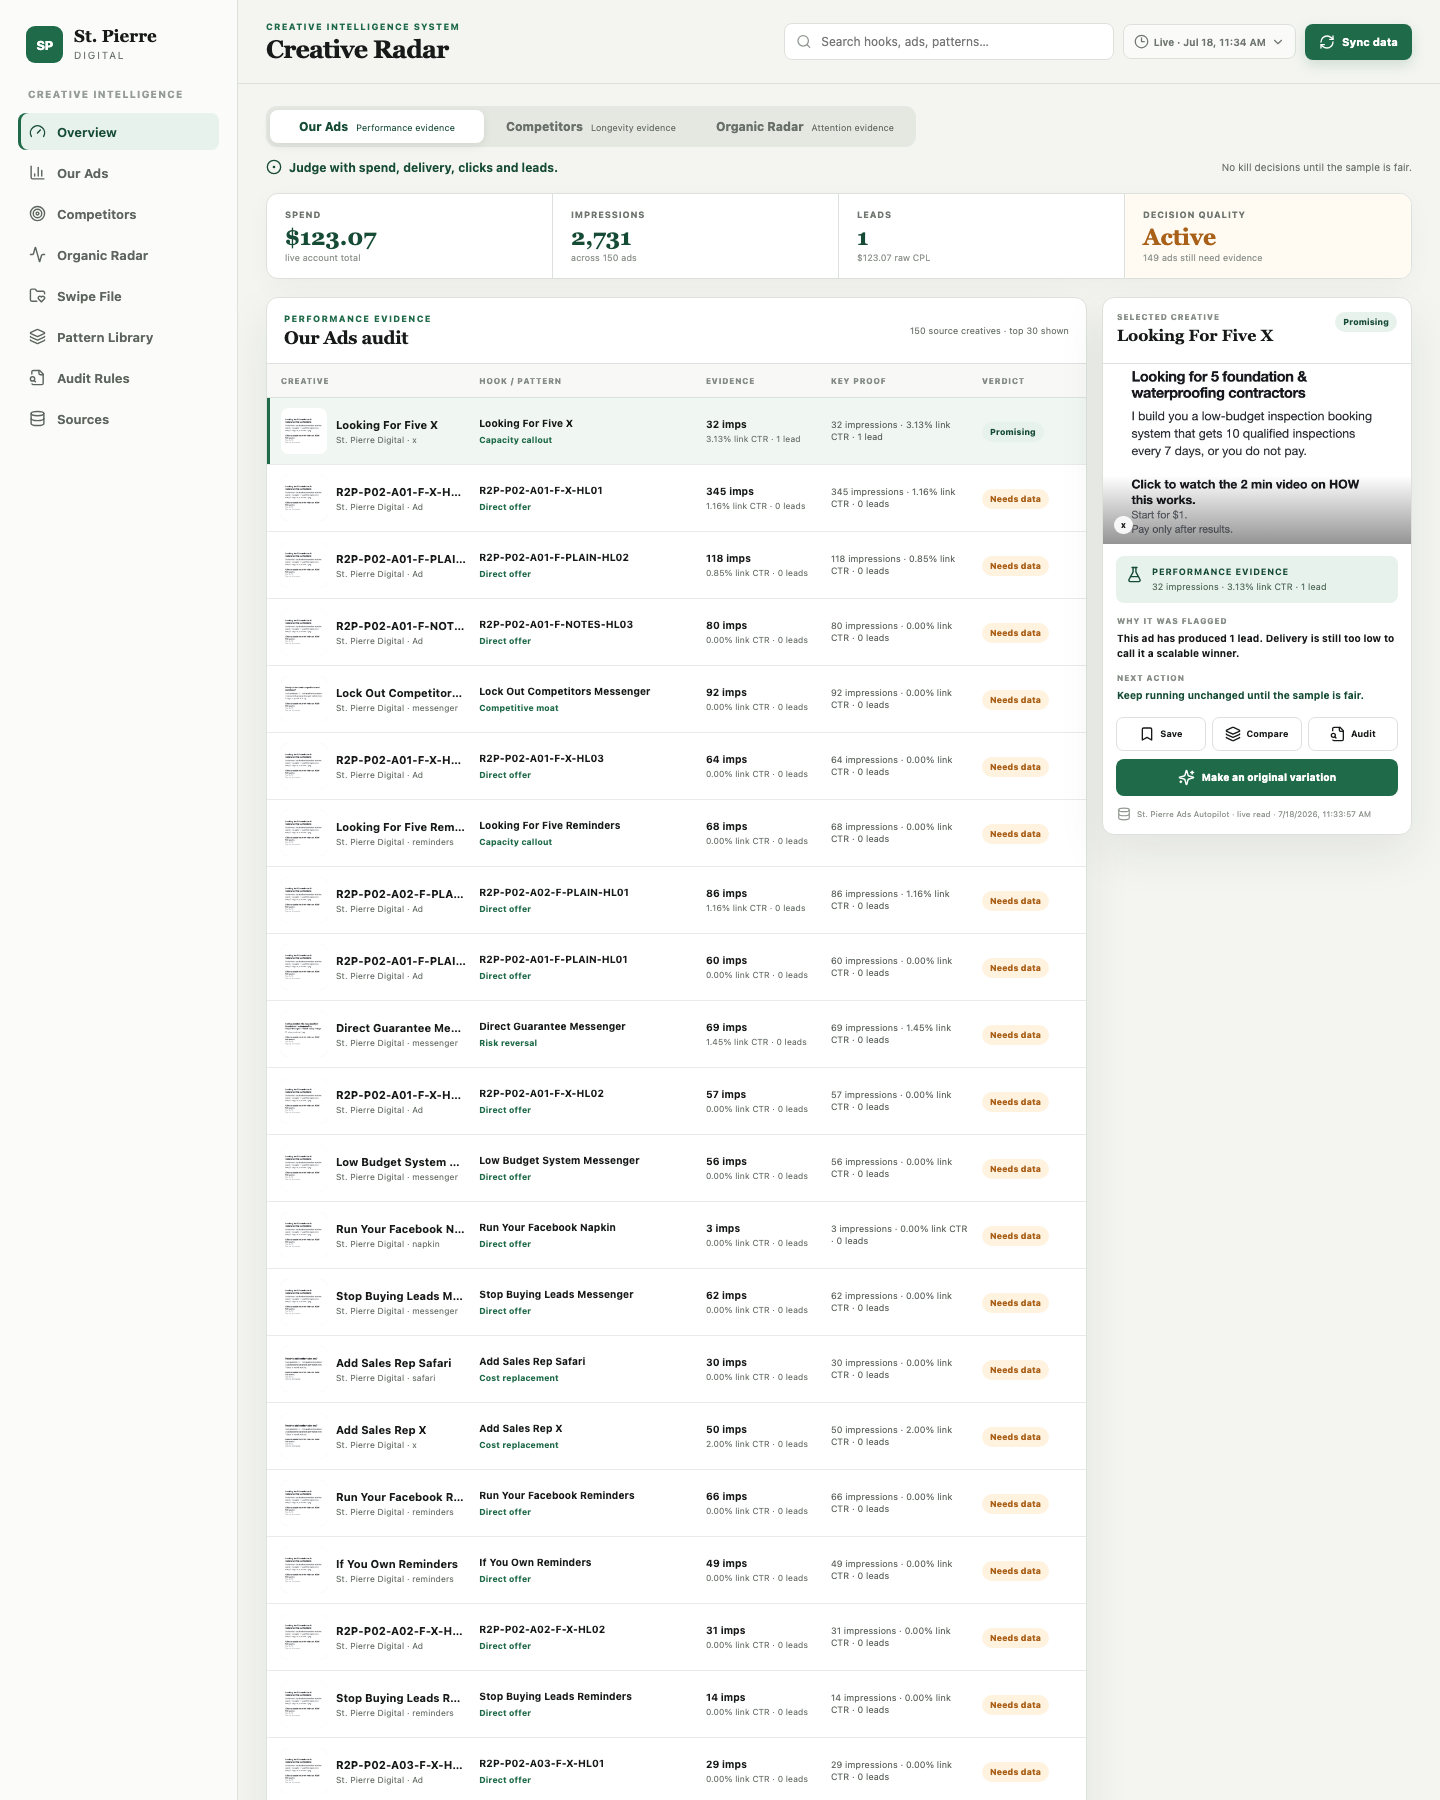
Overview / Our Ads audit
shots/creative-radar-s01.png
Creative radar our ads
How to read itThree tabs — Our Ads (performance), Competitors (longevity), Organic Radar (attention). The tile row shows account totals; the table ranks the top 30 of 150 source creatives with a verdict per ad (Promising / Needs data).
What we see right nowSpend $123.07, impressions 2,731 across 150 ads, 1 lead ("$123.07 raw CPL"), Decision Quality "Active — 149 ads still need evidence." Only "Looking For Five X" is Promising (32 impressions, 3.13% CTR, 1 lead). Naming violation: the top-left logo reads "St. Pierre DIGITAL" and every ad row is labelled "St. Pierre Digital · Ad" — baked into the Meta page name feeding the board.
What to look forGreen flag = more ads earning "Promising" as spend accumulates. Red flag = the raw-CPL framing ($123.07) with no qualified filter, and the "St. Pierre Digital" label everywhere. Action: correct the page/brand name at the source; stop showing raw CPL as the hero.
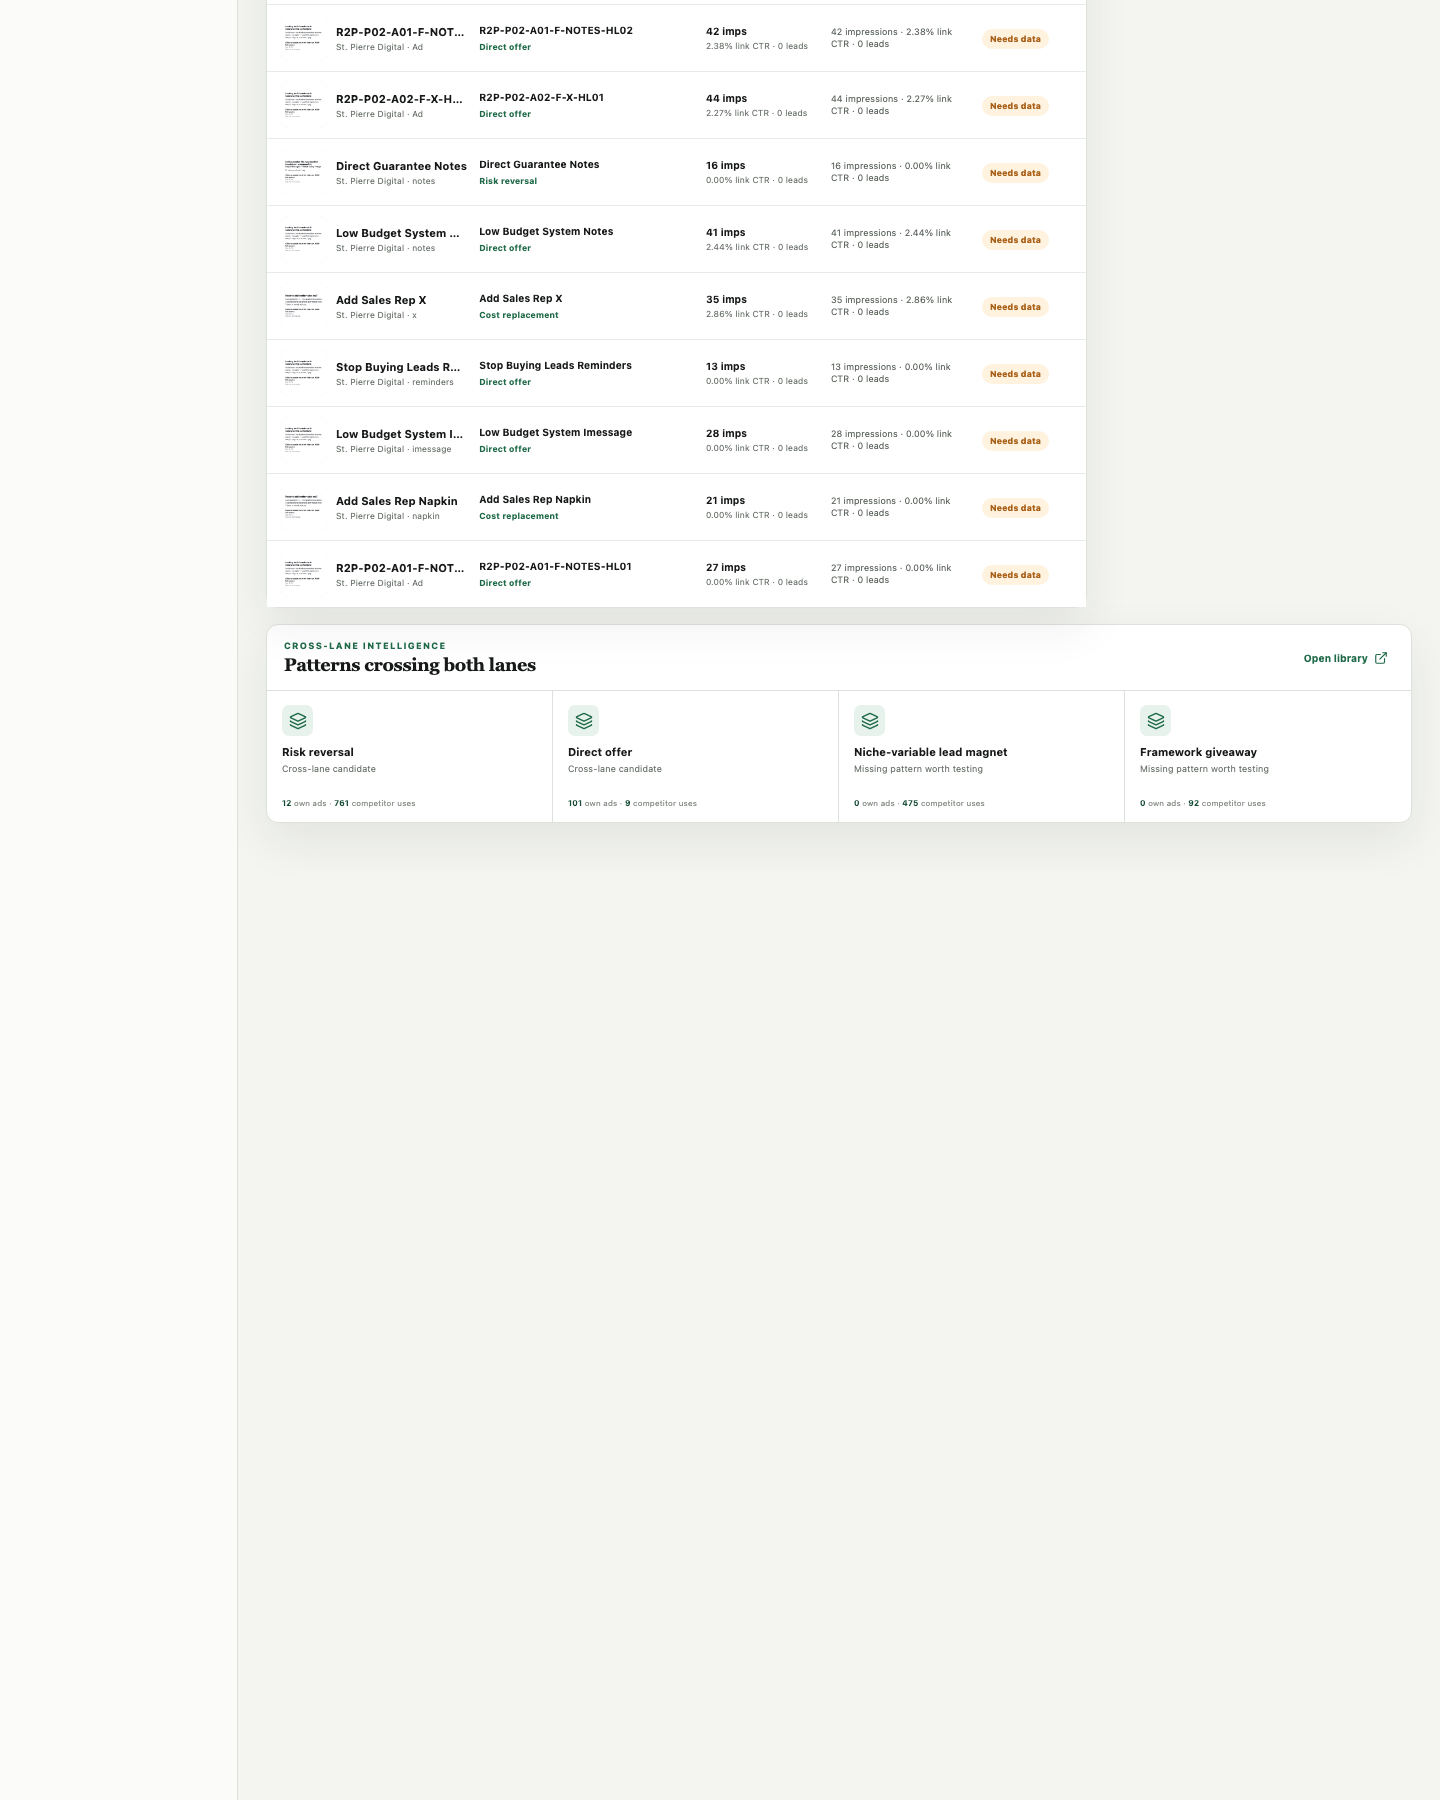
Cross-lane patterns
shots/creative-radar-s02.png
Creative radar patterns
How to read it"Patterns crossing both lanes" compares how often a creative pattern appears in your ads vs competitors' — a gap-finder for angles worth testing.
What we see right nowRisk reversal — 12 own vs 761 competitor uses. Direct offer — 101 own vs 9 competitor (you over-index). Niche-variable lead magnet — 0 own vs 475 competitor (big untested gap). Framework giveaway — 0 own vs 92 competitor. Two "missing pattern worth testing" cards: lead-magnet and framework-giveaway.
What to look forGreen flag = closing a gap where competitors cluster. Red flag = concentration in one pattern (direct offer, 101 ads) while competitors diversify. Action: the "niche-variable lead magnet" gap (475 competitor uses, 0 yours) is the clearest angle to test next.
Footer / sources
shots/creative-radar-s03.png
Creative radar footer
How to read itA "One honest scorecard — different proof for each lane" callout and a "Live sources connected" status (First-party · Ad Library · Reels).
What we see right nowSources show connected. Mostly whitespace below the pattern cards — the board is shorter than it looks.
What to look forRed flag = "Live sources connected" turning off (competitor/organic feed broke). No action today.
Ads Pipeline Board CONSOLIDATE LOCAL stuck-inventory workflow board

What it is: shows how many ads sit in each pipeline stage, their age, and which are past the 48h SLA. Status: LOCAL, generated 2026-07-18 11:41, header says "read-only, not deployed." When to open: rarely — on trigger when inventory seems stuck. Hero check: no line graph. Verdict: CONSOLIDATE → Ads Autopilot (its whole signal overlaps the hub tile + Autopilot's staged section).

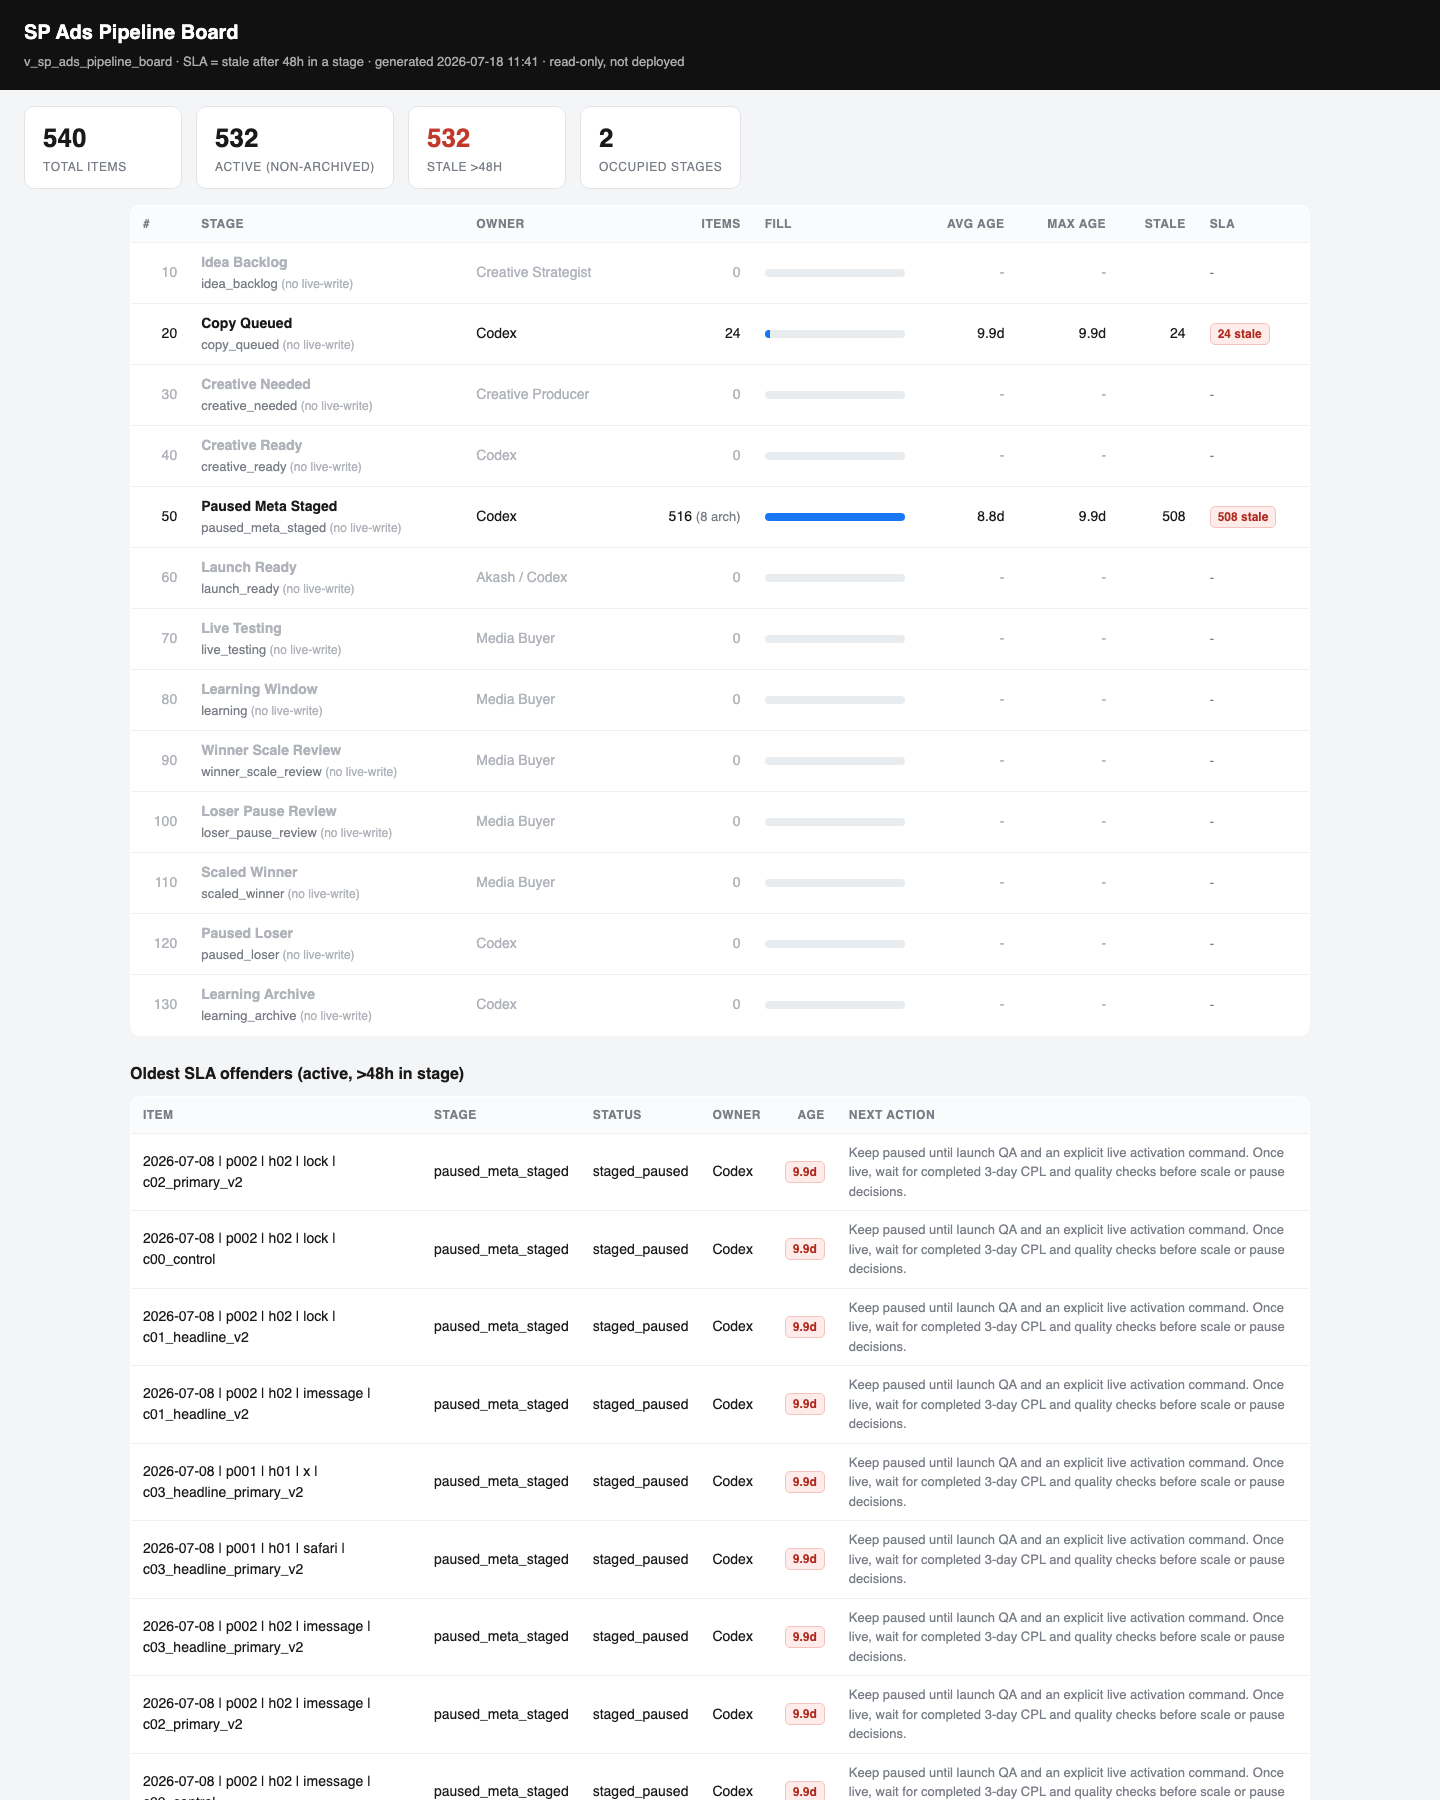
Stage summary
shots/ads-pipeline-board-s01.png
Ads pipeline stage summary
How to read itTiles: 540 total, 532 active, 532 stale >48h, 2 occupied stages. The table lists 13 stages (Idea Backlog → Learning Archive) with items, fill bar, ages, SLA badge. Every stage marked "(no live-write)."
What we see right nowOnly 2 of 13 stages hold anything: Copy Queued (24 items, all 9.9d) and Paused Meta Staged (516 items, 508 stale, max 9.9d). All stages between staging and launch are empty. Everything is red-stale because inventory was built 2026-07-08 and parked ~9.9d.
What to look forGreen flag = items flowing into Launch Ready / Live Testing. Red flag = the 508-stale block — but the footer correctly explains it's "expected while activation is CP-gated, not a workflow leak." Action: none while parked; "no live-write" means this board can never update itself — a static snapshot, which is why it folds into the live cockpit.
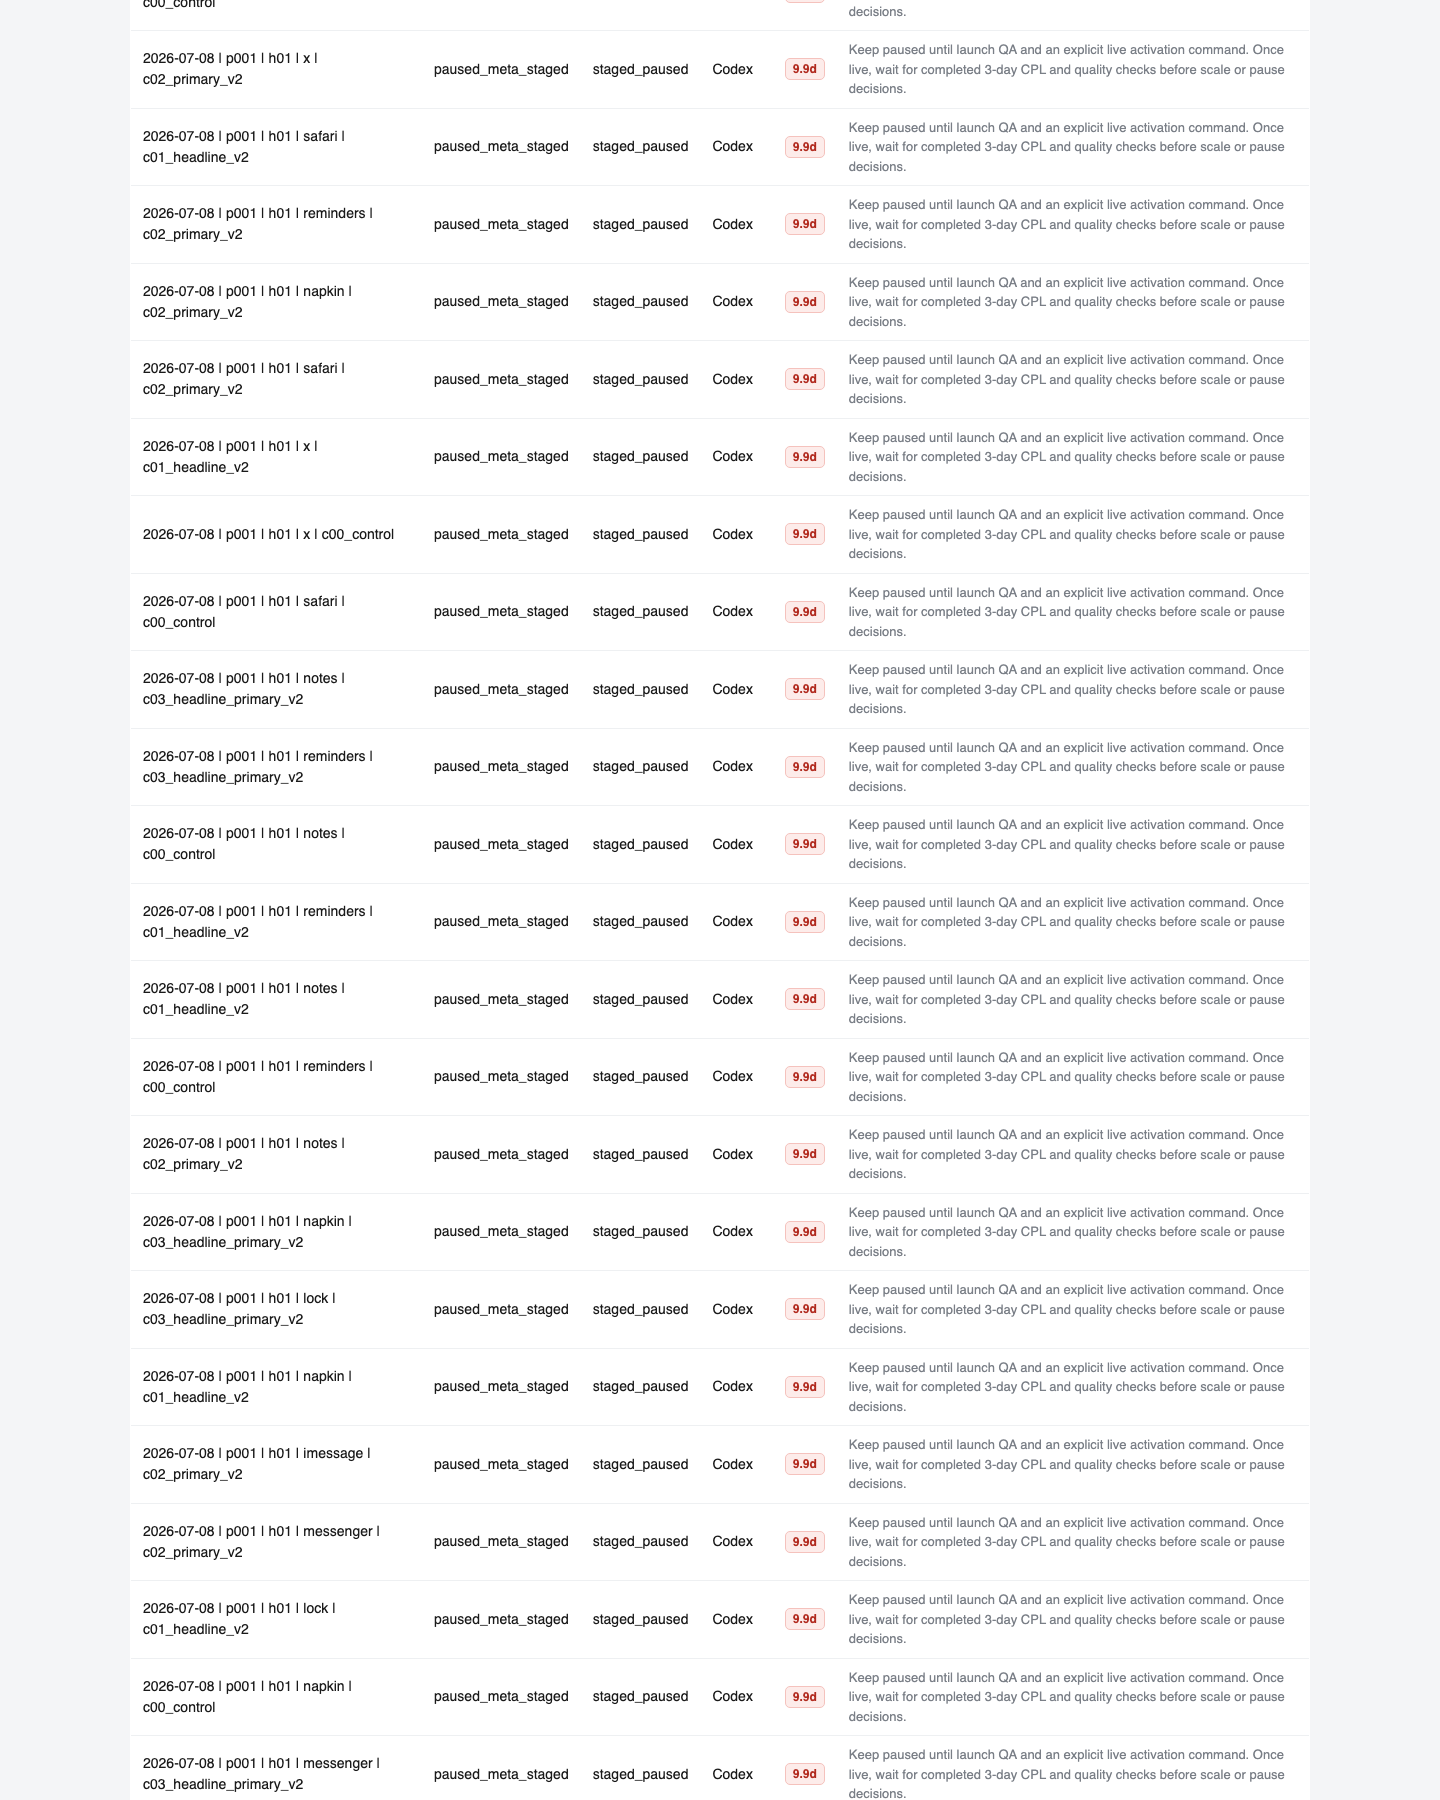
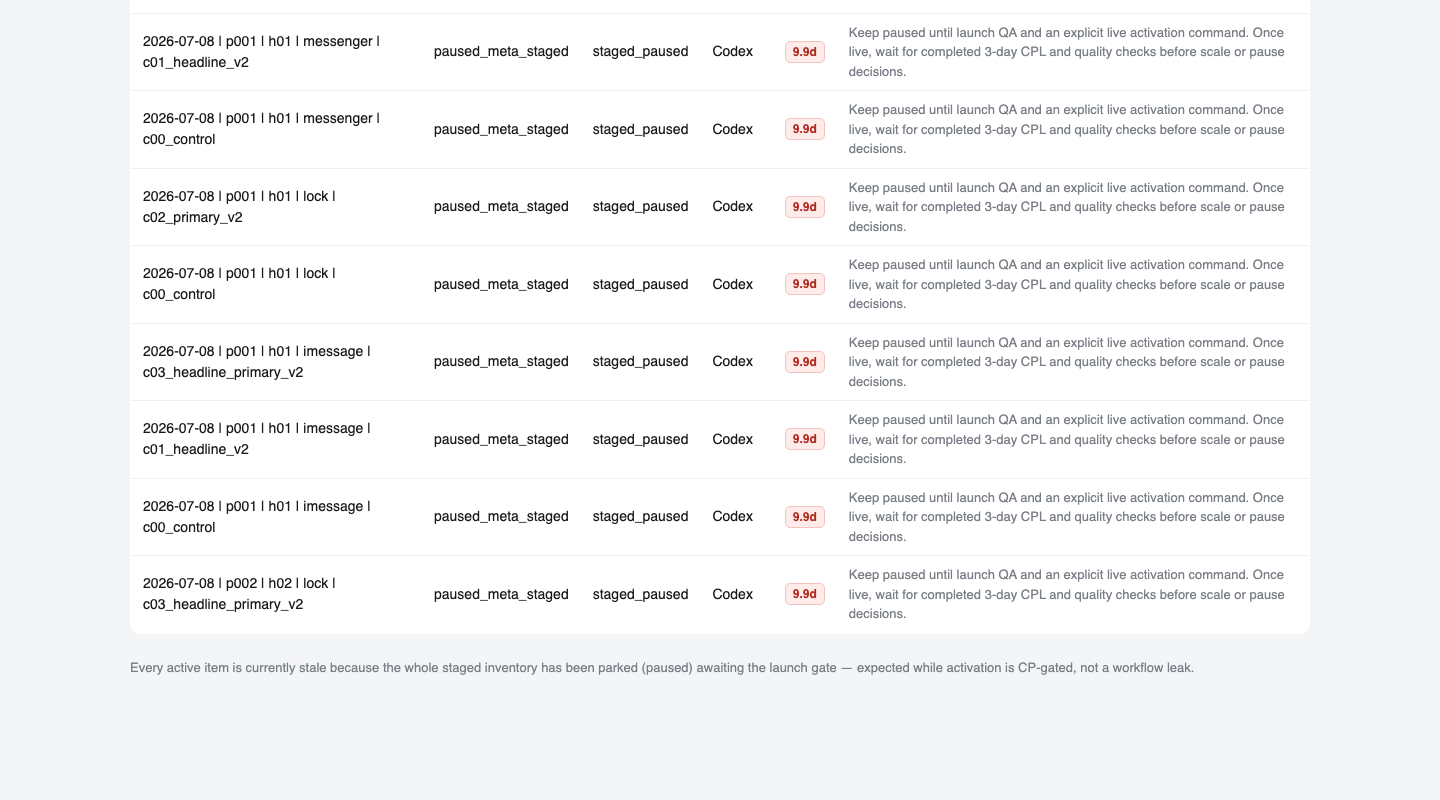
Oldest SLA offenders
shots/ads-pipeline-board-s02.png
Ads pipeline offenders s02
shots/ads-pipeline-board-s03.png
Ads pipeline offenders s03
How to read itA long list of the oldest stuck items with stage, status, owner, age, next-action note.
What we see right nowDozens of identical rows, all 2026-07-08 | paused_meta_staged | staged_paused | Codex | 9.9d, every one carrying the same note: "Keep paused until launch QA and an explicit live activation command."
What to look forRed flag = a genuinely new stuck item (a fresh date, different stage) buried in the list. Today there is none — one homogeneous parked block. Action: none; 40+ identical rows saying the same thing is exactly why it doesn't earn a daily slot.
Attribution Timeline TOOL LIVE per-lead investigation drill-down

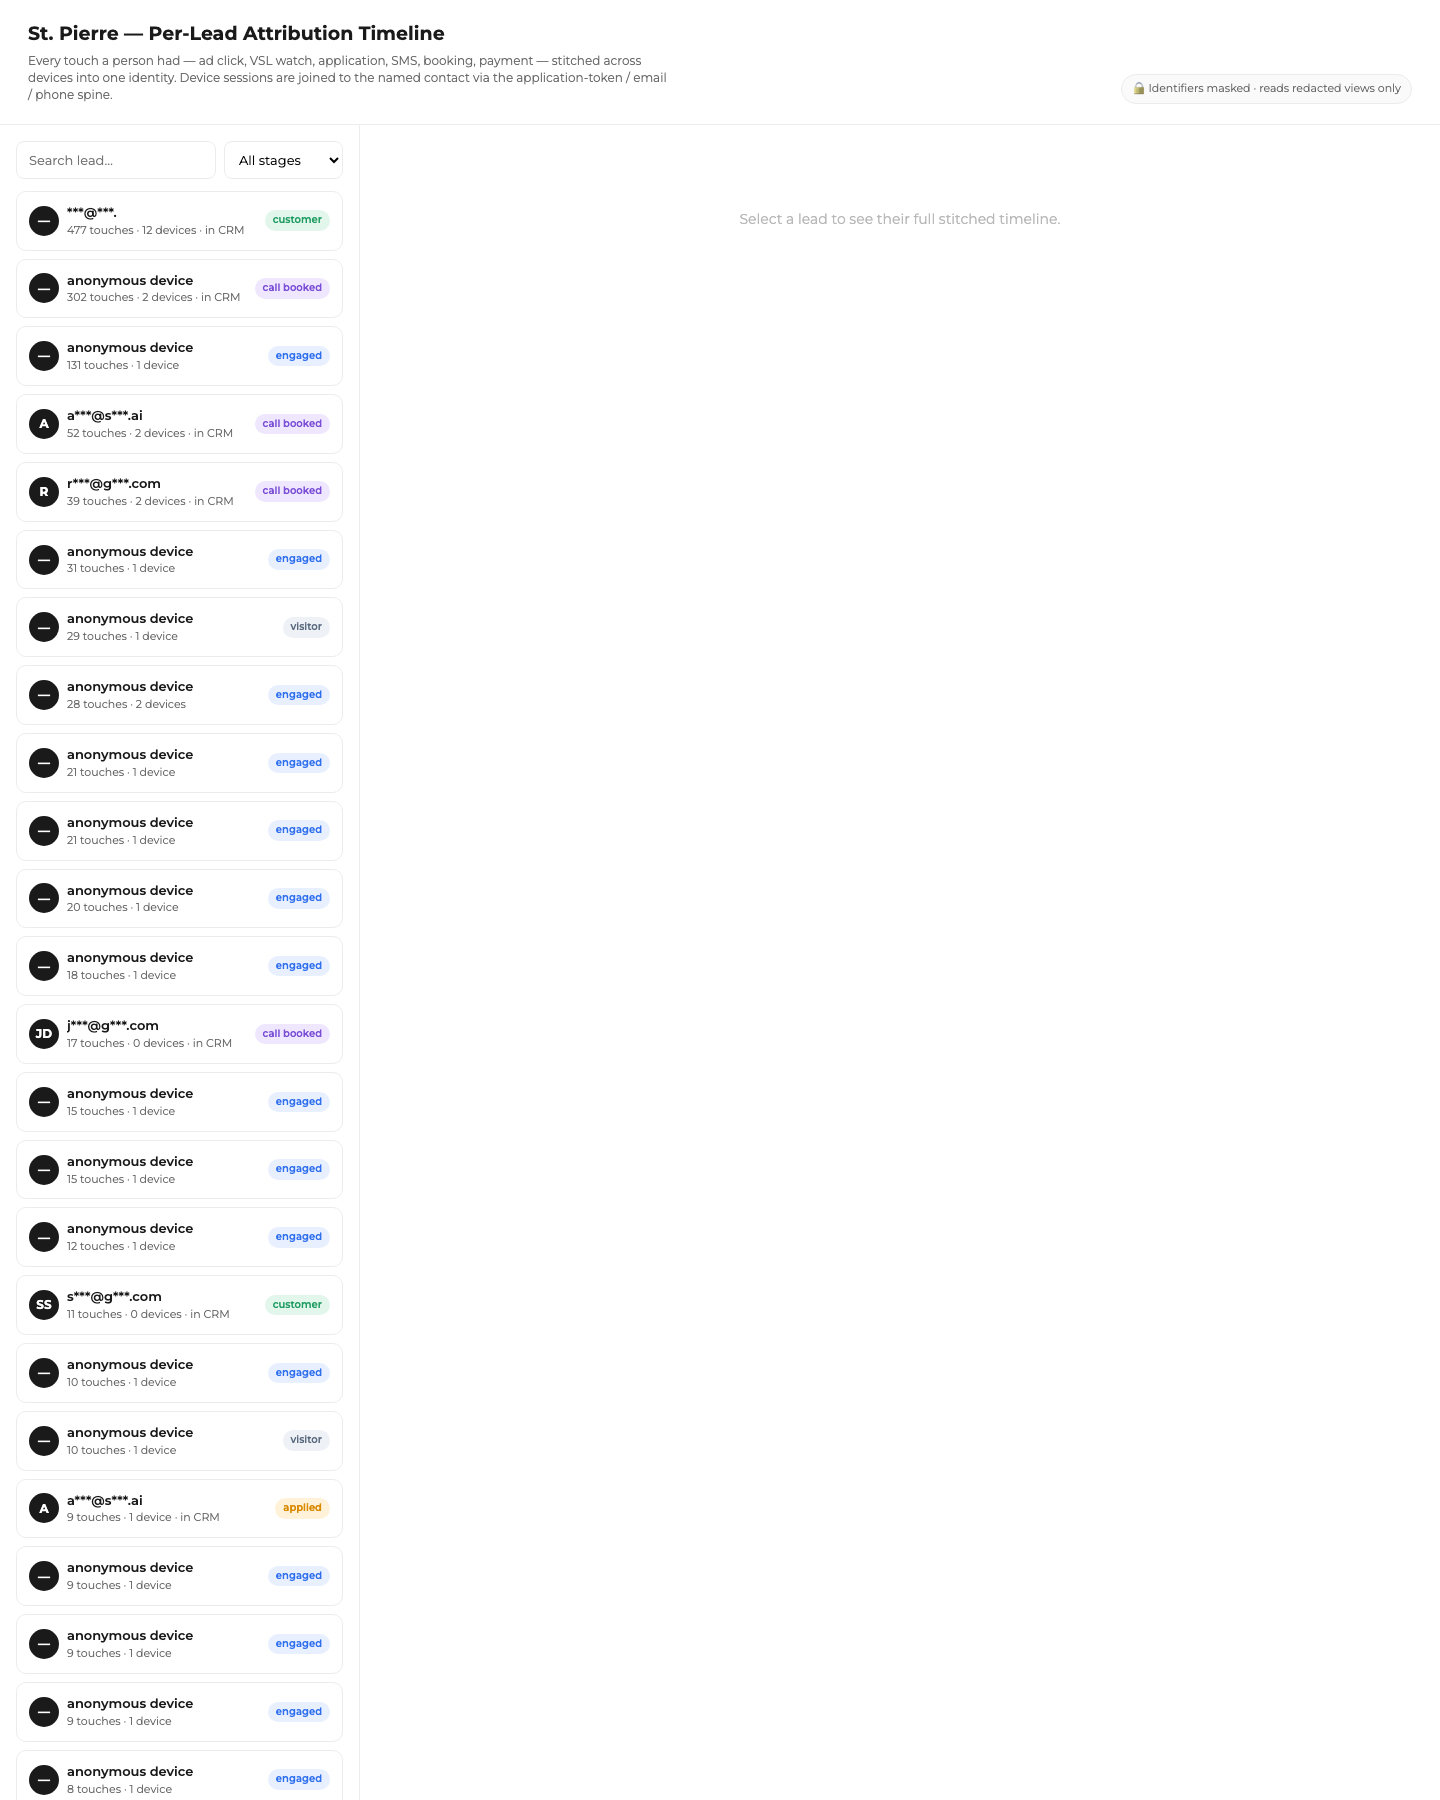
What it is: pick one person and see every touch they had (ad click → VSL watch → application → SMS → booking → payment) stitched across all their devices into one identity. Status: LIVE, "Identifiers masked · reads redacted views only." When to open: on-trigger, to understand one specific lead's path. Hero check: none by design — the right pane stays blank until you click a lead. Verdict: KEEP but reclassify as a TOOL on a tools shelf.

Lead list (left rail)
shots/attribution-timeline-s01.png — the lead list (heavy hitters at top)
Attribution timeline lead list
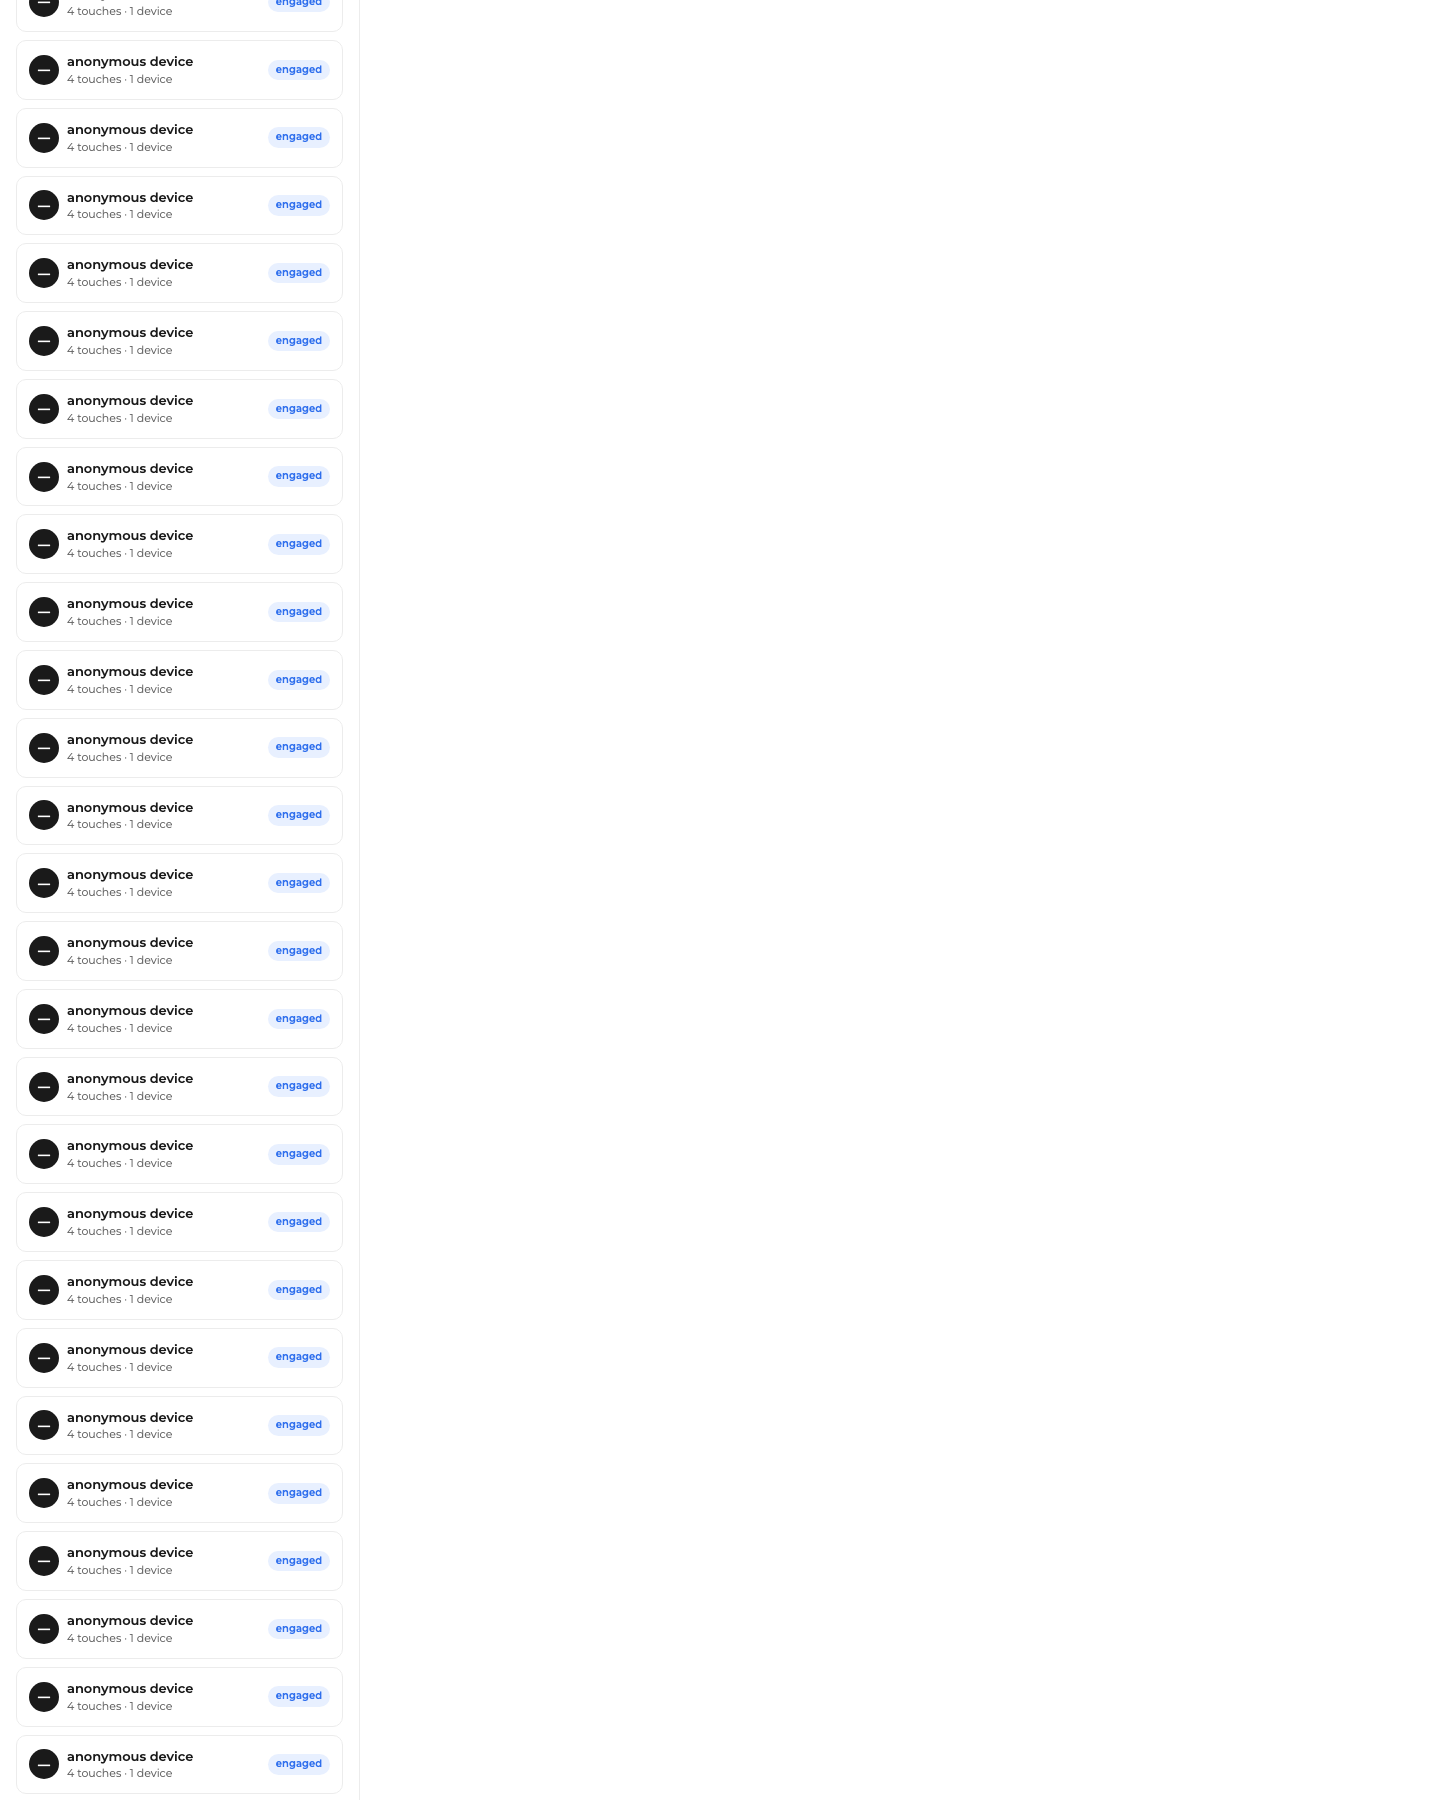
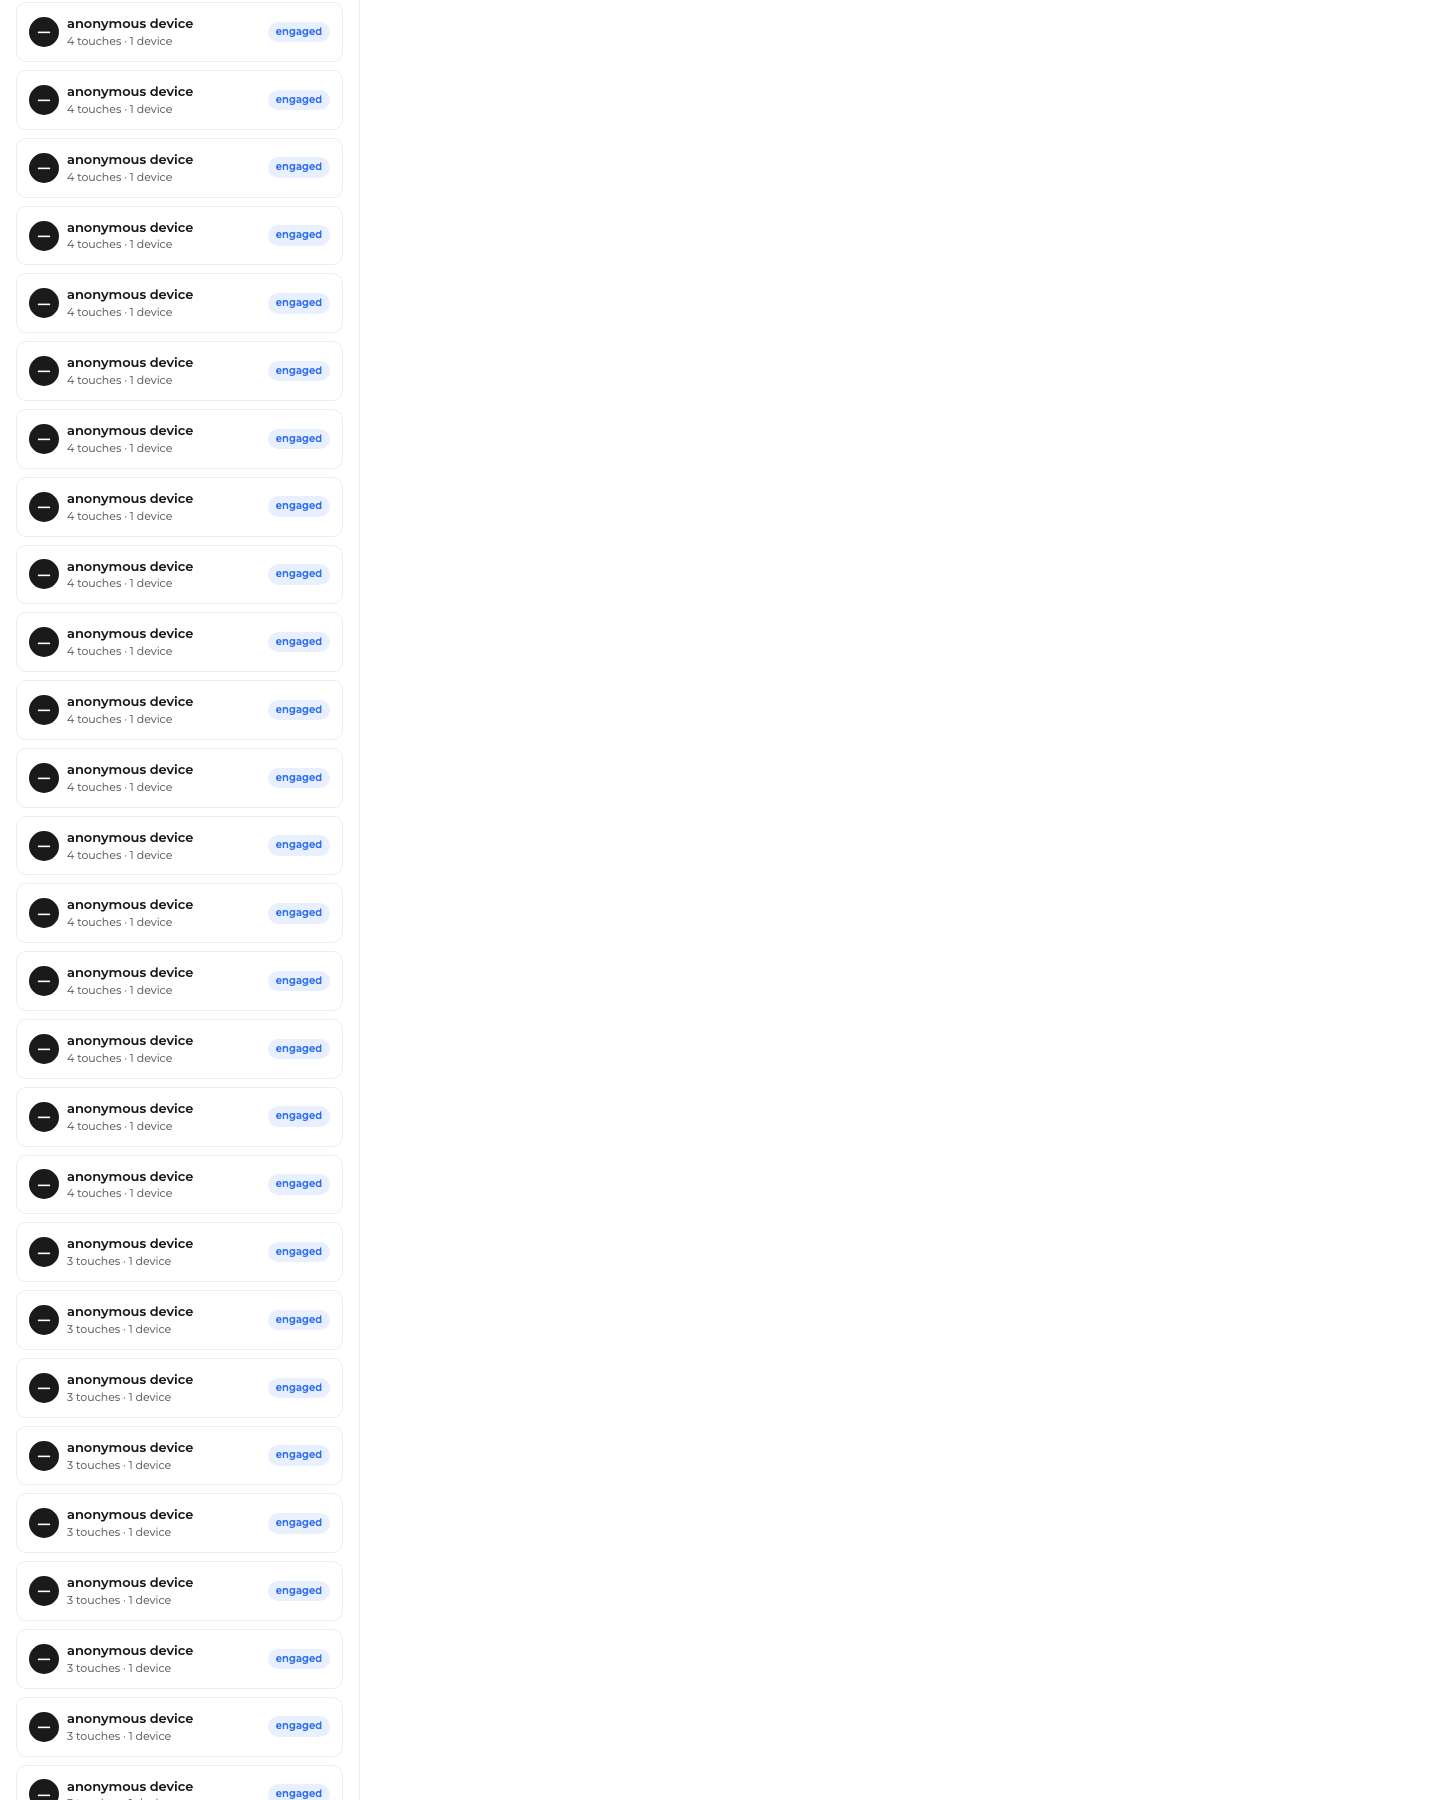
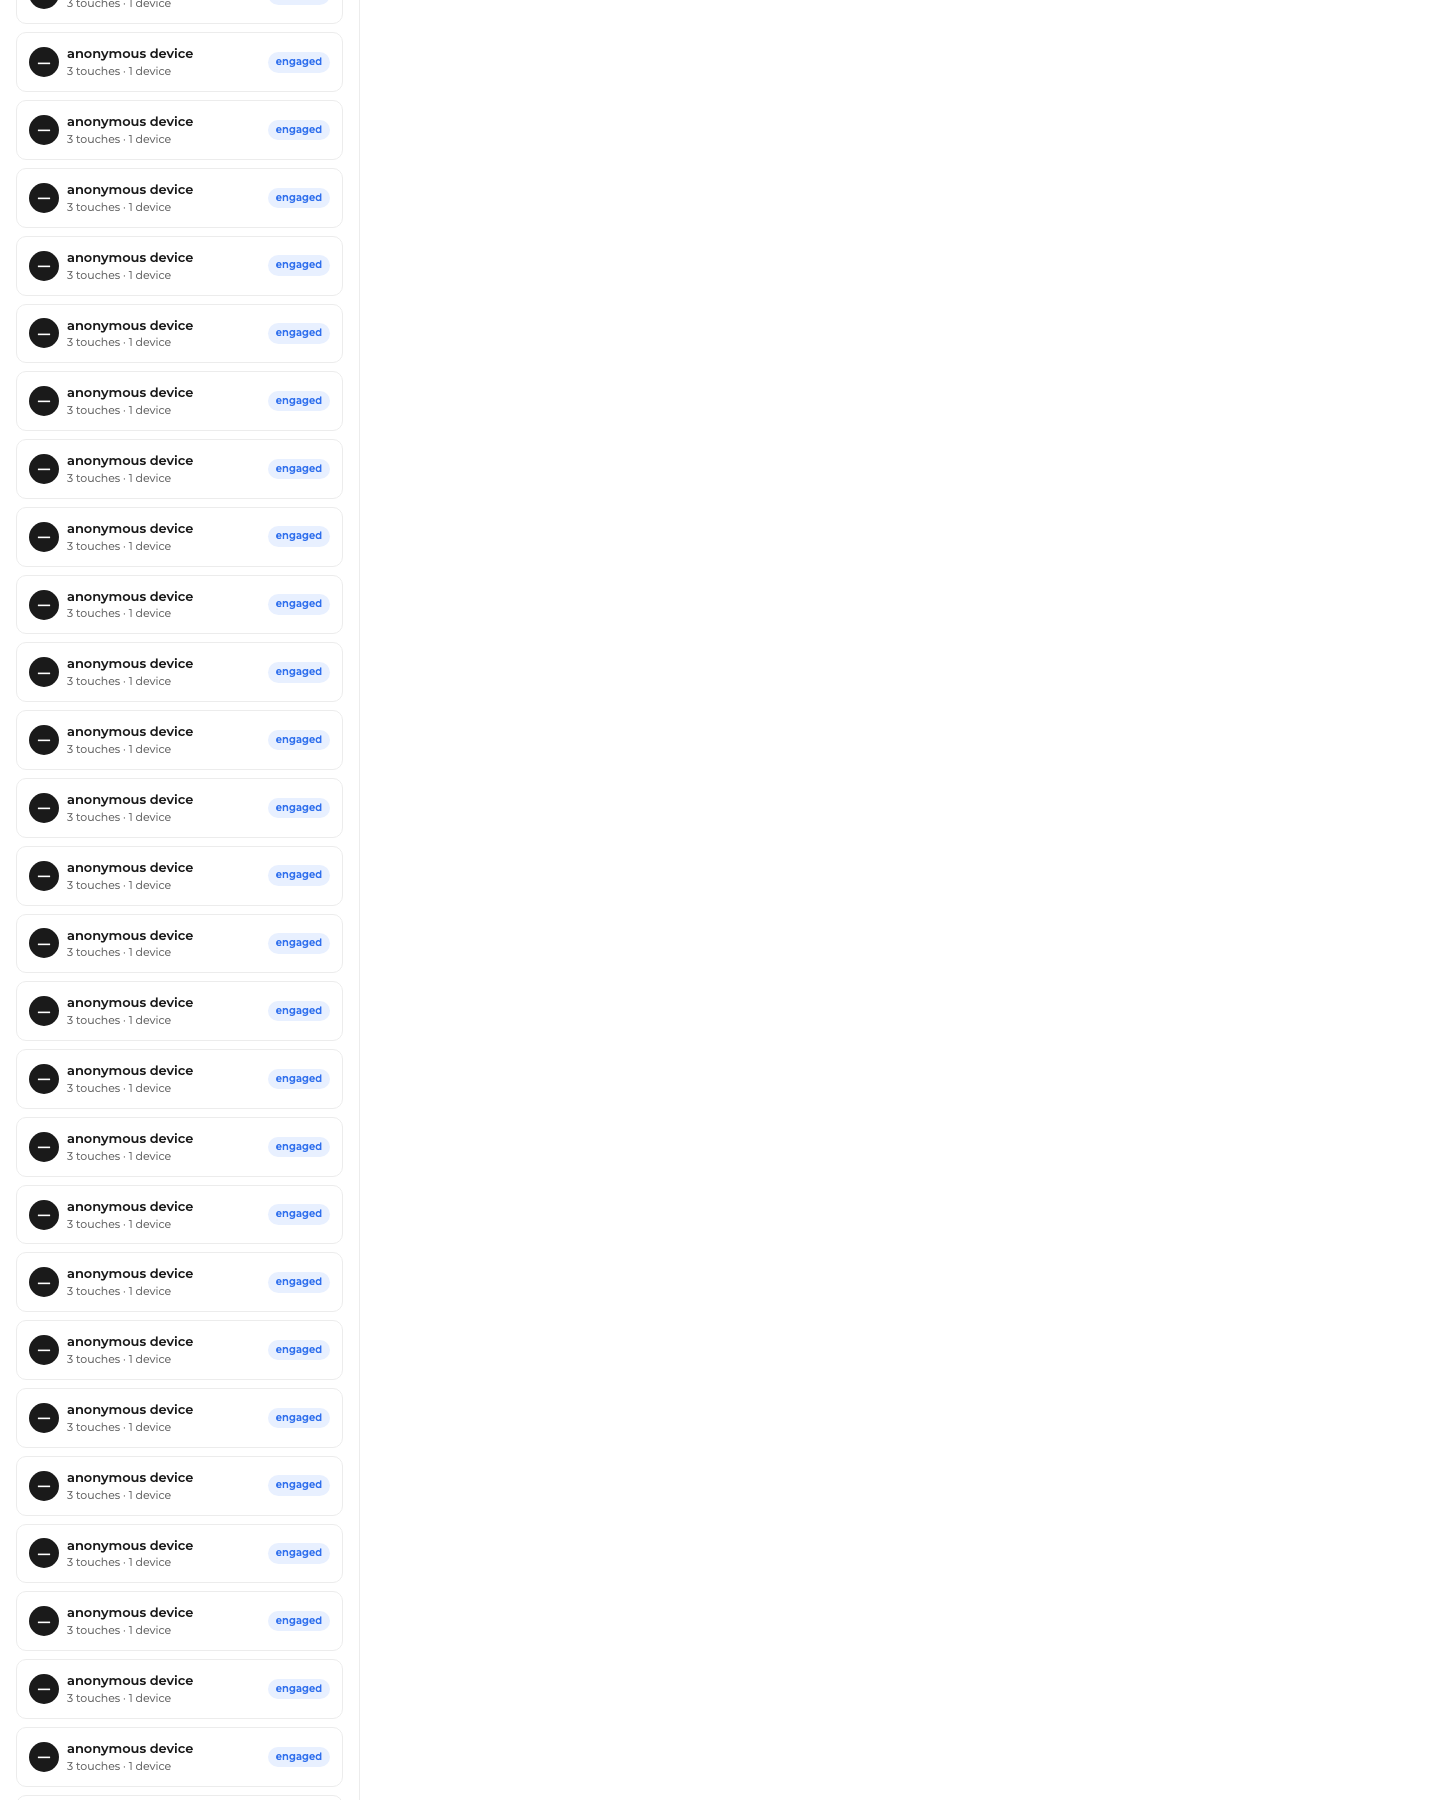
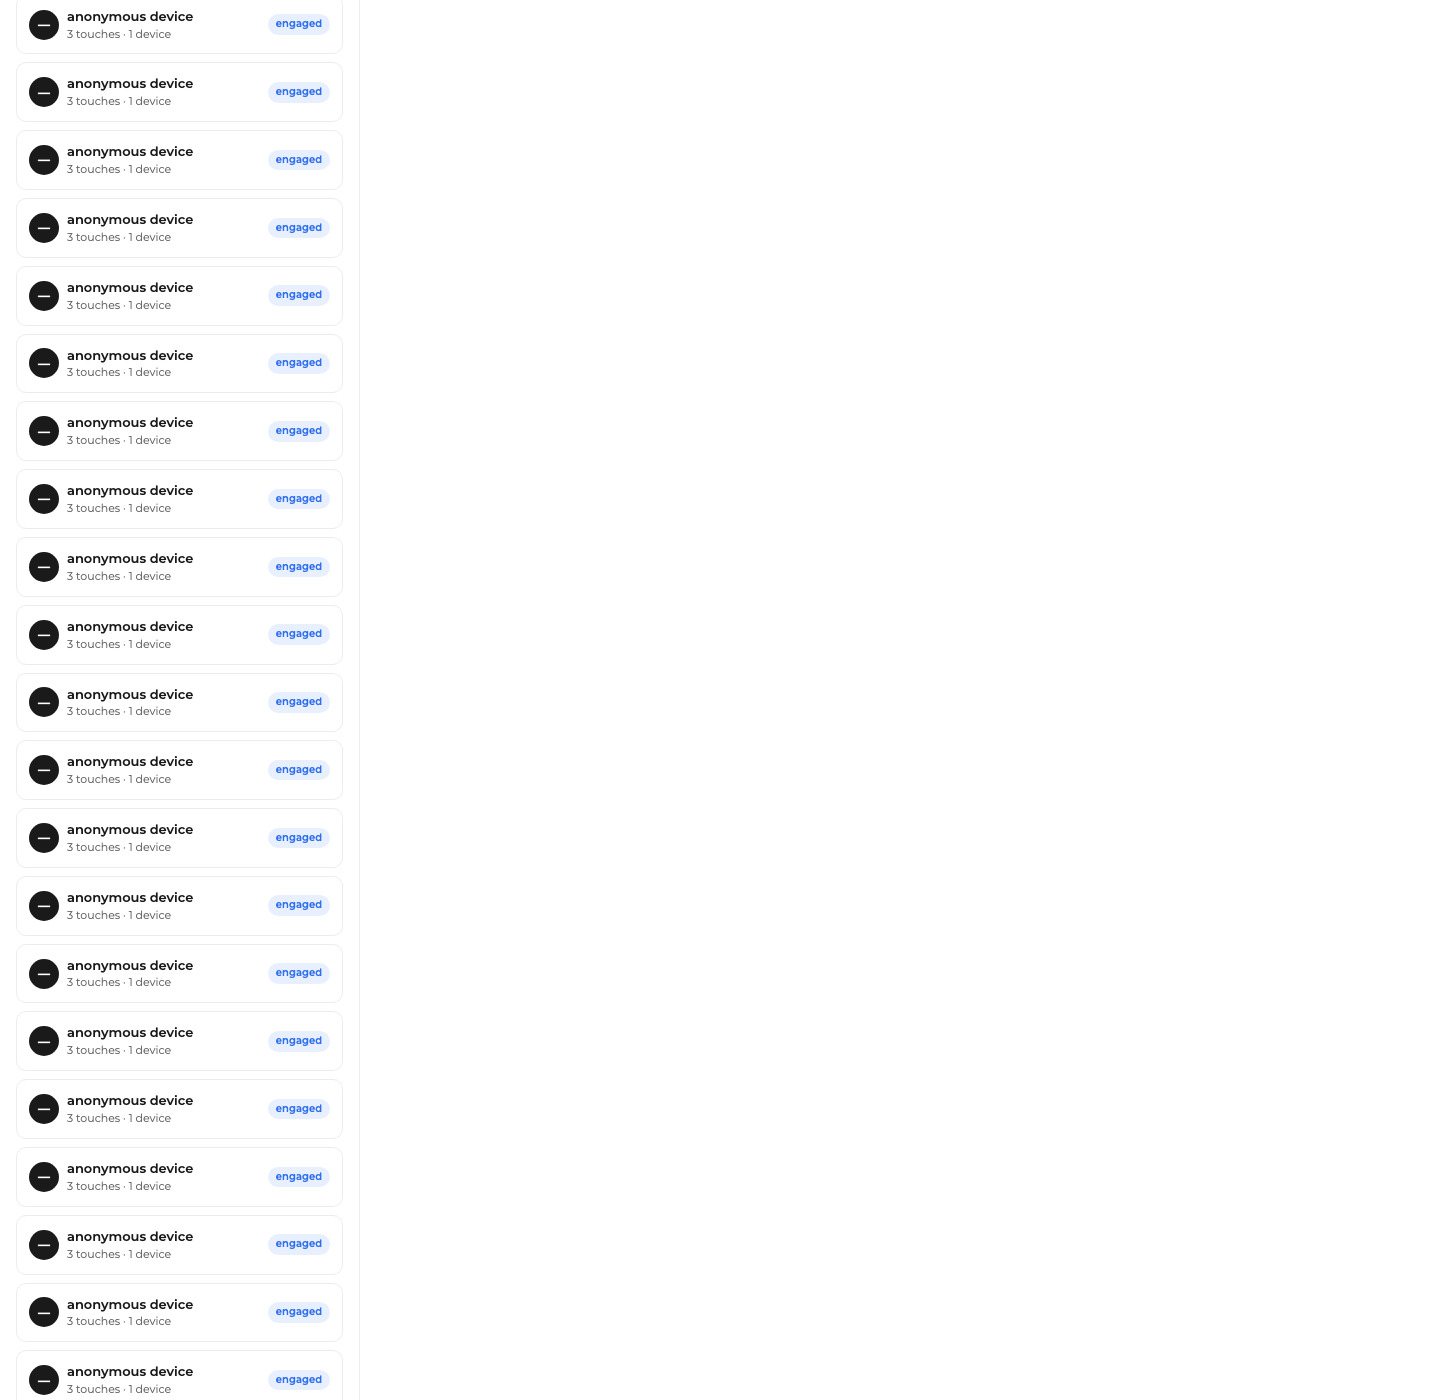
The long anonymous tail (slices s02–s08)
shots/attribution-timeline-s02.png
Attribution timeline s02
shots/attribution-timeline-s03.png
Attribution timeline s03
shots/attribution-timeline-s04.png
Attribution timeline s04
shots/attribution-timeline-s05.png
Attribution timeline s05
shots/attribution-timeline-s06.png
Attribution timeline s06
shots/attribution-timeline-s07.png
Attribution timeline s07
shots/attribution-timeline-s08.png
Attribution timeline s08
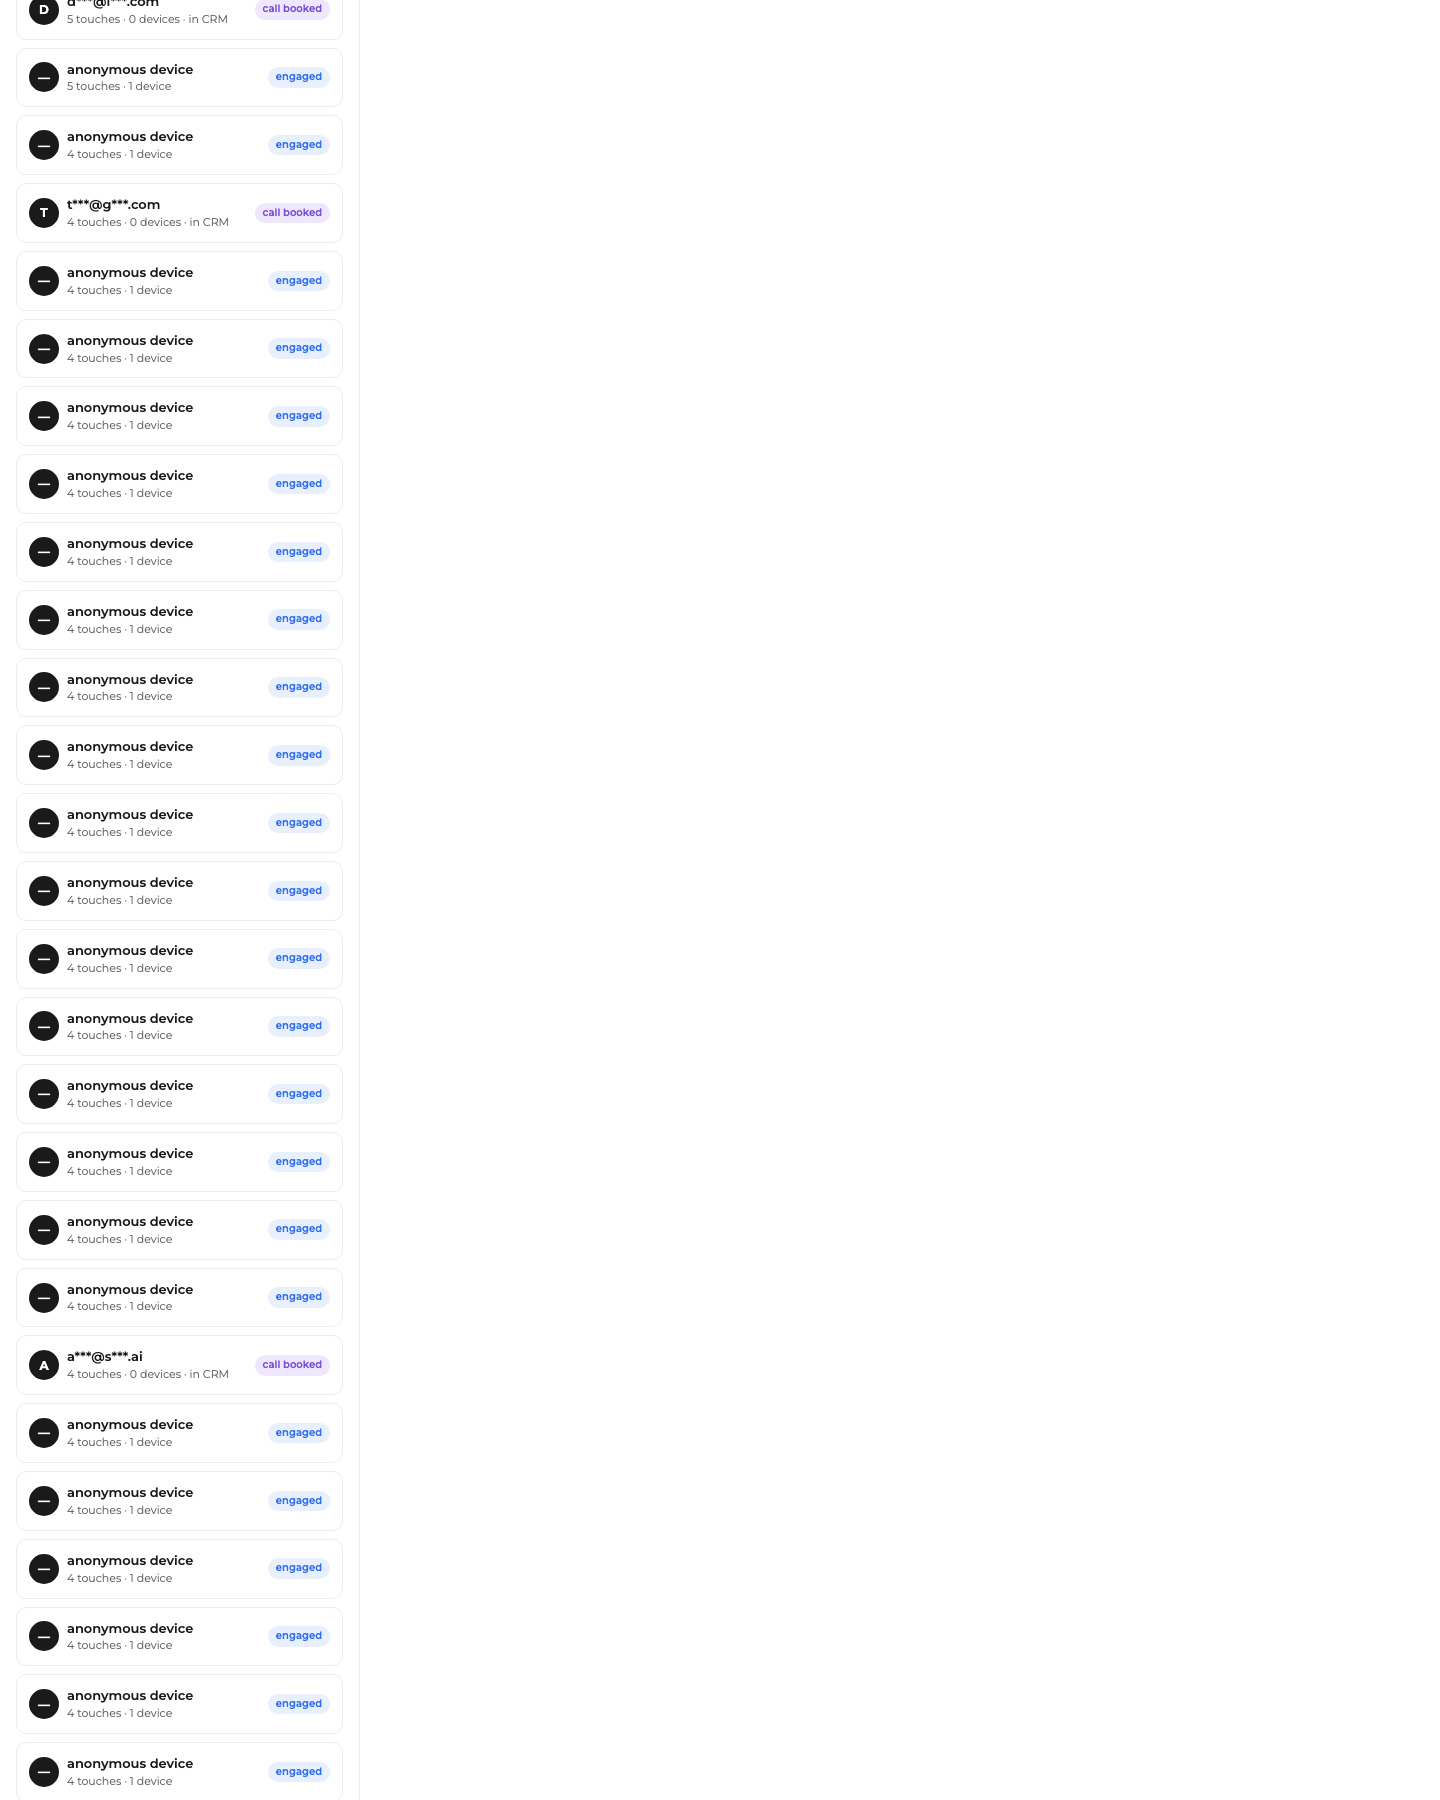
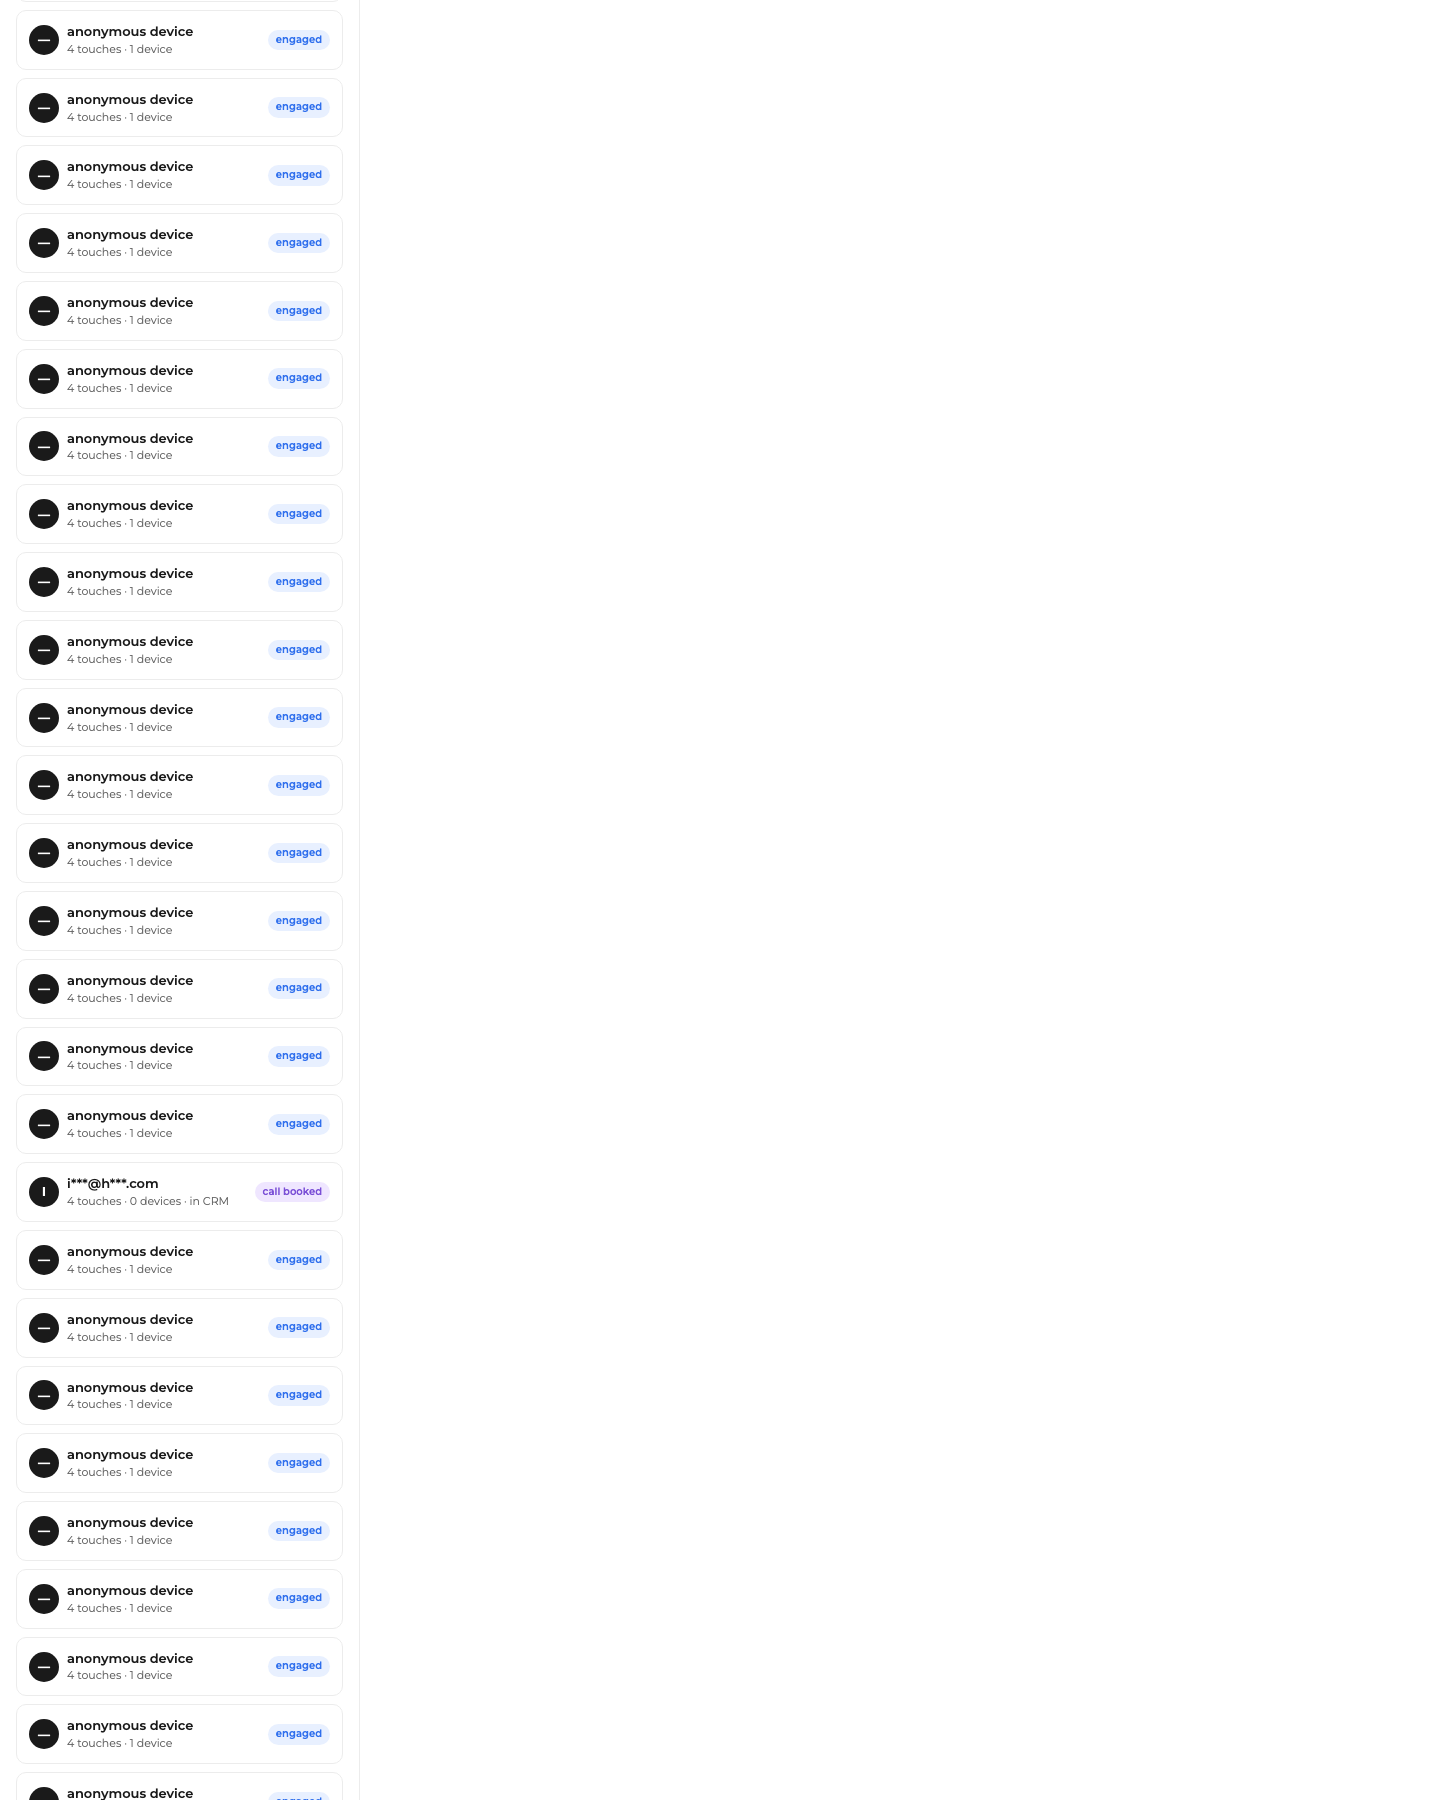
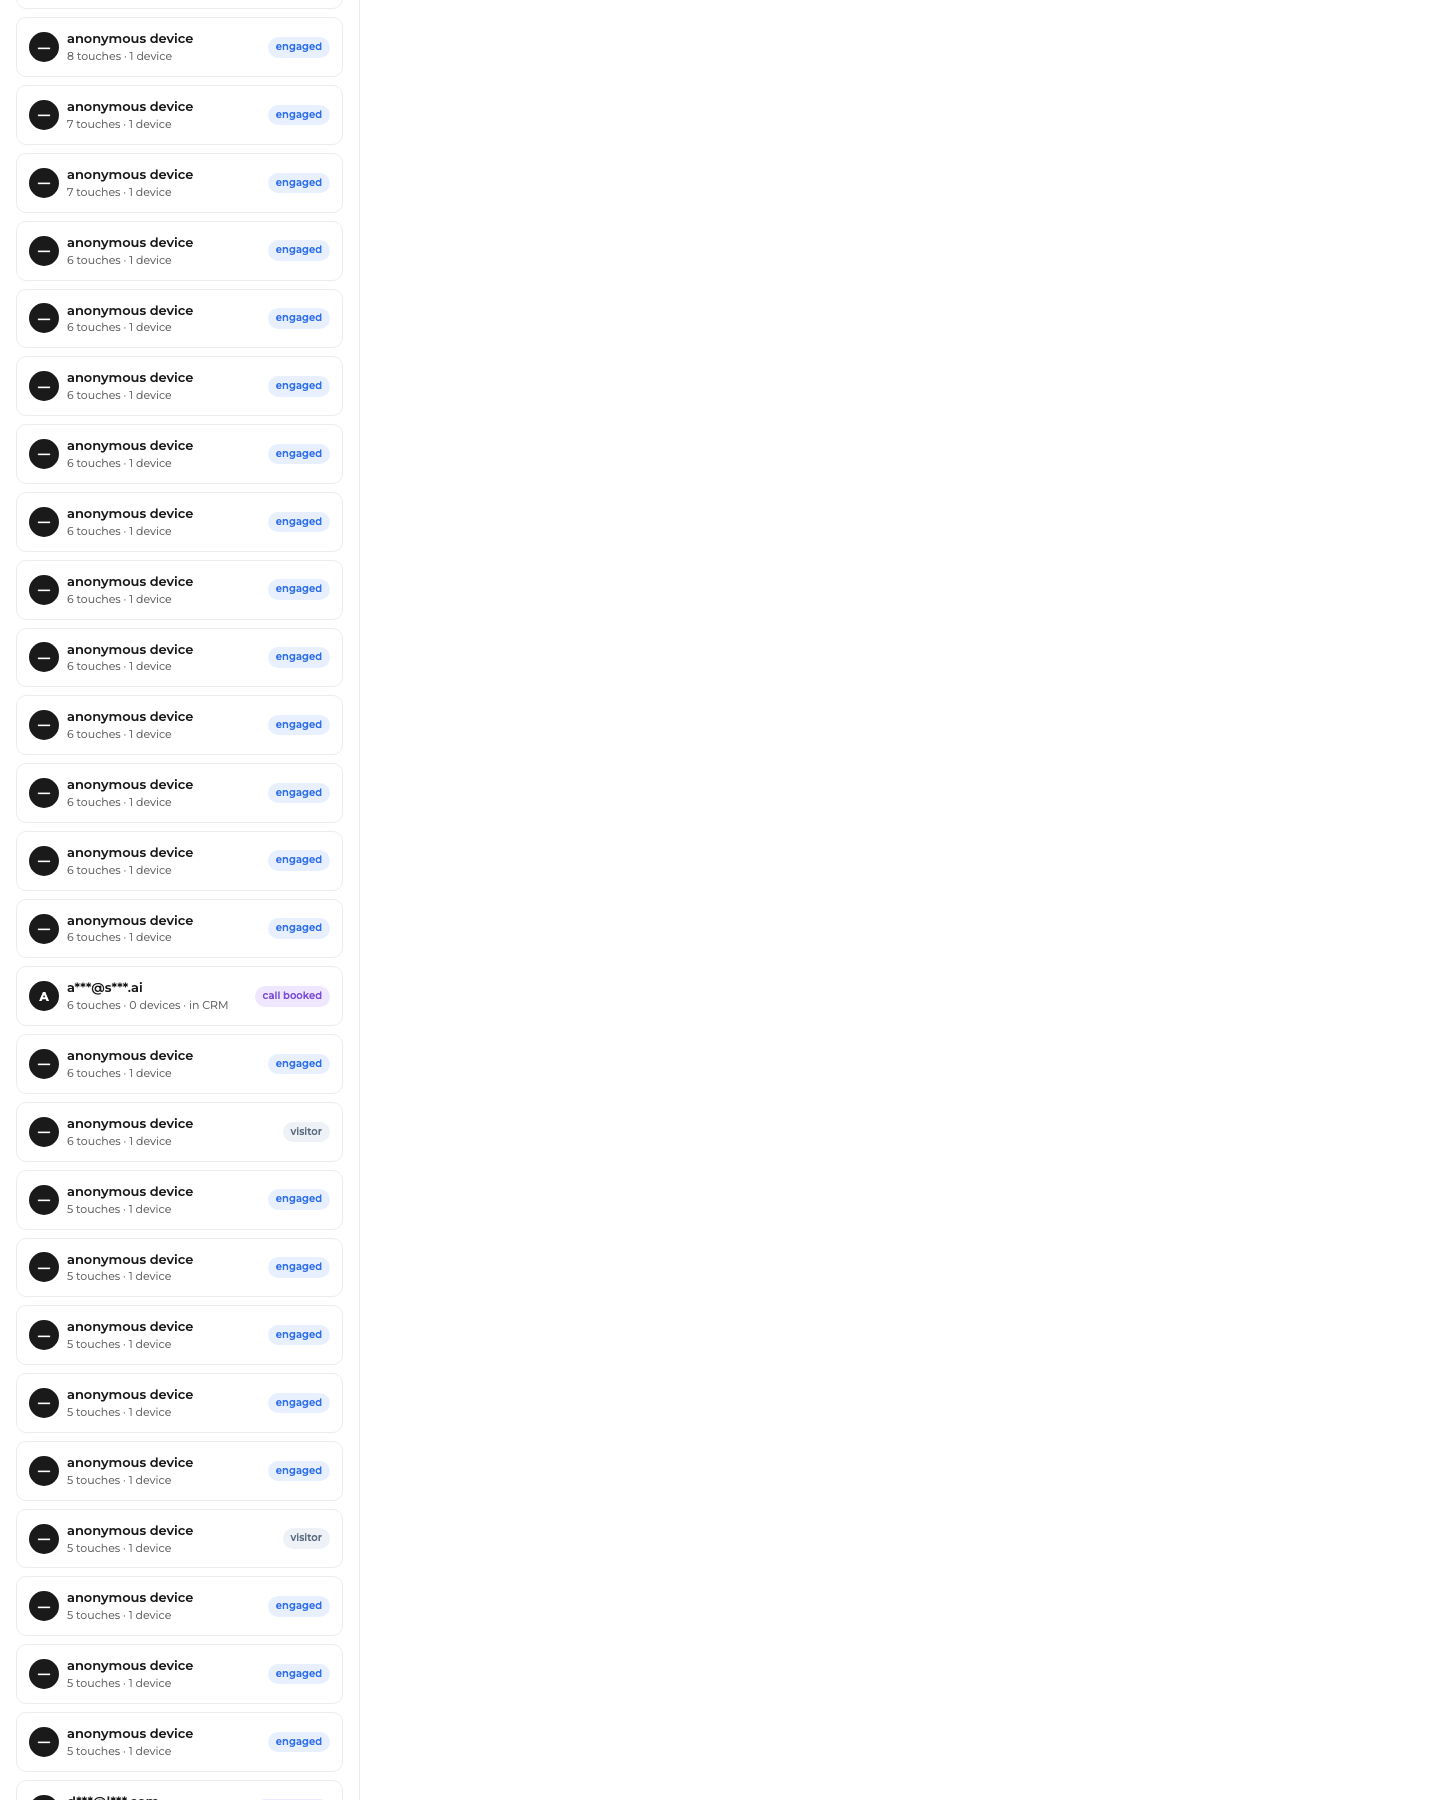
How to read itA scrollable list of leads sorted by touch count, each showing masked identity, touch count, device count, CRM status, and a stage badge (customer / call booked / engaged / applied / visitor).
What we see right nowThe top has the heavy hitters — a customer with 477 touches / 12 devices, an anonymous device with 302 touches / 2 devices / in CRM, then several "call booked" contacts (52, 39, 17 touches). Below the top ~25 the list becomes a very long tail of "anonymous device · 3–4 touches · engaged" — hundreds across slices s02–s08. Most traffic is anonymous, low-touch, un-stitched to a named contact.
What to look forGreen flag = named contacts with a "call booked"/"customer" badge and a coherent multi-touch path. Red flag = the volume of low-touch anonymous devices, and named rows showing "0 devices · in CRM" (the device-to-contact stitch didn't complete). Action: use only when a specific lead's journey is in question; for daily "which source works," use PostHog.
PostHog Acquisition & Attribution KEEP LIVE (login) aggregate channel view

What it is: an aggregate acquisition view — new vs returning visitors, and which source gets first-touch vs last-touch credit. Status: LIVE at us.posthog.comrequires login, no screenshot captured (audited from description). When to open: weekly, "where are leads coming from" at the channel level. Hero check: PostHog is time-series by default, so it likely already trends new-vs-returning — closer to the hero ideal than any other board here. Verdict: KEEP — the aggregate counterpart to the per-lead timeline.

How to read it (from description)Answers "which source/channel produces acquisition" in aggregate — complementary to, not a replacement for, the per-lead timeline. Two attribution surfaces is the maximum this room should carry.
What we see right nowBehind login, so it can't sit as a live tile in the local hub — always a click-out. That's acceptable for a weekly board, but CPQL-by-source can't show on the hub without piping PostHog data out.
What to look for (once viewable)First-touch source mix vs last-touch (whether ads open the relationship or just close it), and the new-vs-returning ratio (a healthy cold-acquisition engine should skew new).

Confusing bits to fix (the wife test)

  • CPQL / CPL / CPQBC look interchangeable but mean different things — add a one-line glossary on-screen.
  • "St. Pierre DIGITAL" on Creative Radar (logo + every ad row) — fix at the Meta page-name source.
  • Hub says "$0 / Zero ads serving" while every cockpit shows real spend + 1 lead — reconcile it.
  • "Insufficient-data" (120 of 122) sounds broken — say "too little spend to decide yet" in plain words.
  • Format suffixes (Postit, Napkin, Lock, iMessage, Safari, X) are unexplained templates — add a legend.
  • "No live-write" = "this snapshot can't update itself." Say it plainly.
  • "VSL apps" = applications after watching the video sales letter — spell out on first use.
  • CBO / Advantage+ / ABO appear with no definition — define on first use.
  • Stage badges (visitor / engaged / applied / call booked / customer) have no legend for the order.
  • "9.9d" in red everywhere reads as failure; the "expected while parked" note should sit next to the scary count, not only at the bottom.
  • Attribution Timeline opens blank ("Select a lead…") — add a prominent "click any lead on the left" hint.

6 · 📞 Sales Room

The room in plain English

This is the "People pipeline" room — where a lead becomes a booked call becomes a signed, paid client. Its one job: keep every real opportunity moving right. Lead in → qualified → booked call → close → cash.

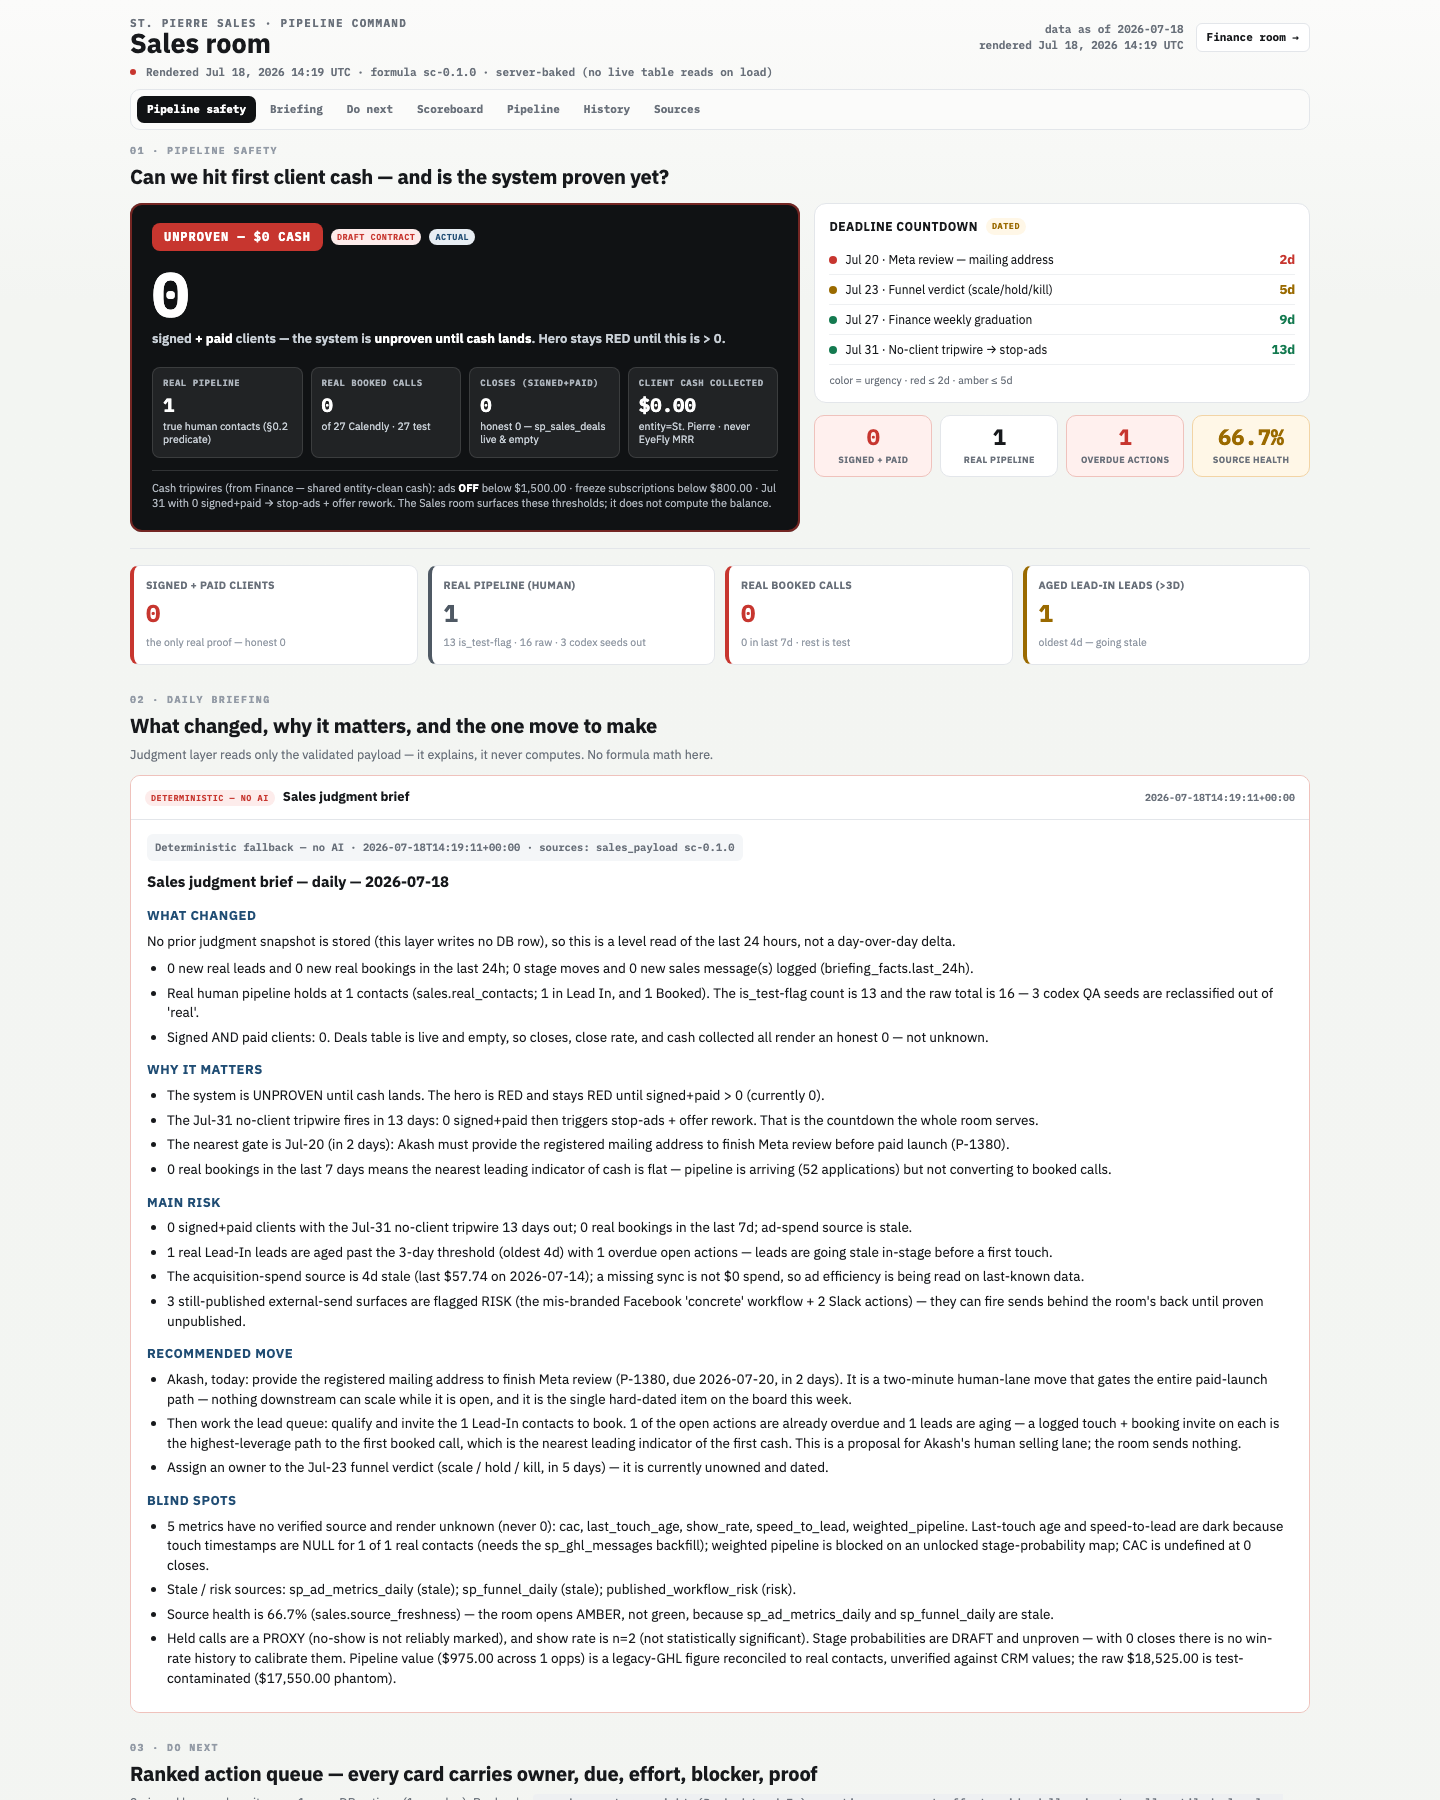
The room runs on one source of truth. The honest answer today (refreshed Jul-22): 5 real contacts, 1 genuine booked call (a concrete-leveling contractor), 0 closes, $0 cash collected — show rate computes 100% off that single call (n=1). Two filter bugs were fixed Jul-22 (a test-flag leak and a booking clean-run window) that had been mis-counting; the walkthrough screenshots further down are the Jul-19 capture and predate the fix. The hero tile literally reads "UNPROVEN — $0 CASH" and stays red until signed-and-paid clients > 0.

Everything else is test data or plumbing the room quarantines so it can't pollute the real numbers. 15 of 16 CRM contacts and most GHL opportunities are flagged test and excluded — the room's most important discipline: no phantom pipeline.

Room KPI recommendation

Core company KPI this room feeds: Cash collected (entity = St. Pierre) → MRR. This room is the last mile before money lands.

  • 1. RPL — revenue per lead (hero)not tracked. Both inputs exist (cash $0; leads = 52 Typeform apps OR 127 funnel events OR 5 real contacts) but no surface divides them. The declared hero exists on no screen — the single biggest gap, and blocked on the leads-denominator decision.
  • 2. Real booked callstracked. Leading. Honest 1 as of Jul-22 (a concrete-leveling contractor) after the booking clean-run fix; the remaining Calendly events stay test-excluded.
  • 3. Cash collectedtracked. Lagging. Honest $0.00 because the deals table is live and empty (0 rows), not missing.

Note: this board runs its OWN 24-metric contract ("METRIC-CONTRACT sc-0.1.0"), a narrower system than the company's 25-metric scorecard_weekly. That divergence should be reconciled so "close rate" means one thing company-wide.

Consolidation verdict

DashboardVerdictWhy
Sales Command CenterKEEPThe room's spine — deterministic, server-baked, honest about real vs test. Add a line-graph hero.
Sunday Sales BriefRECLASSIFYA dated one-off HTML that's a subset of the Command Center. Move to a reports shelf.
Should the :8765 sales cockpit be a dashboard? No. It's an operational tool (a dialer/worklist you act inside), not a read-only scoreboard. It belongs on a tools/apps shelf, cross-linked from the Command Center's Do-next section — the dashboard hub should stay for read-only trend/status surfaces.
Sales Command Center KEEP LOCAL the daily sales working board

What it is: one page that answers "can we hit first client cash, what's real, and what's the one move today." Status: LOCAL sales.html, rendered Jul 18 14:19 UTC, server-baked; read Jul 19 = ~1 day stale. Internally-flagged stale sources: sp_ad_metrics_daily (4d), sp_funnel_daily (8d). When to open: every morning + before any call block. Hero check: NO — opens with a point-in-time tile ("UNPROVEN — $0 CASH"). Should be a 3-series line: real booked calls/week, cash collected/week, RPL. Verdict: KEEP — the room's spine.

01 · Pipeline safety
shots/sales-command-center-s01.png
Sales command center pipeline safety
How to read itThe big black tile is the single truth: signed + paid clients. It stays RED until > 0. Four small tiles under it (Real pipeline, Real booked calls, Closes, Client cash collected) are the honest, test-excluded counts. Top-right is a deadline countdown (red ≤2d, amber ≤5d) and four status chips.
What we see right nowHero = 0 signed+paid, "UNPROVEN — $0 CASH." Real pipeline = 1. Real booked calls = 0 (of 27 Calendly events, all test). Closes = 0. Client cash = $0.00 (entity = St. Pierre, never EyeFly MRR). Countdown: Jul 20 · Meta review mailing address (2d, red), Jul 23 funnel verdict (5d), Jul 27 finance graduation, Jul 31 no-client tripwire → stop-ads. Chips: 0 signed+paid, 1 real pipeline, 1 overdue action, 66.7% source health. Cash tripwires: ads OFF below $1,500, freeze subscriptions below $800.
What to look forGreen = hero > 0 (first cash landed). Red → actions: (a) the Jul-20 Meta mailing-address item at 2 days is the hard gate blocking all paid launch — do it today; (b) clear the 1 overdue action; (c) source health 66.7% means two feeds are stale — treat downstream ad/funnel numbers as last-known; (d) Jul 31 with 0 signed+paid cuts ad spend.
02 · Daily briefing
shots/sales-command-center-s02.png
Sales command center briefing + do next
How to read itA plain-English judgment brief that READS the numbers (never computes new math): What changed, Why it matters, Main risk, Recommended move, Blind spots. Tagged "Deterministic — no AI."
What we see right now"No prior snapshot, so this is a level read of the last 24h." 0 new real leads, 0 new bookings, 0 stage moves. Recommended move: provide the registered mailing address to finish Meta review (P-1380, due Jul-20), then work the 1 aged Lead-In (Todd). Blind spots: 5 metrics render "unknown, never 0" (cac, last_touch_age, show_rate, speed_to_lead, weighted_pipeline) because touch timestamps are NULL for the 1 real contact. Pipeline value $975 is legacy-GHL; raw $18,525 is test-contaminated ($17,550 phantom).
What to look forRead "Recommended move" as your literal to-do. Read "Blind spots" to know which tiles to distrust — anything marked unknown/UNSOURCED is dark, not zero.
03 · Do next
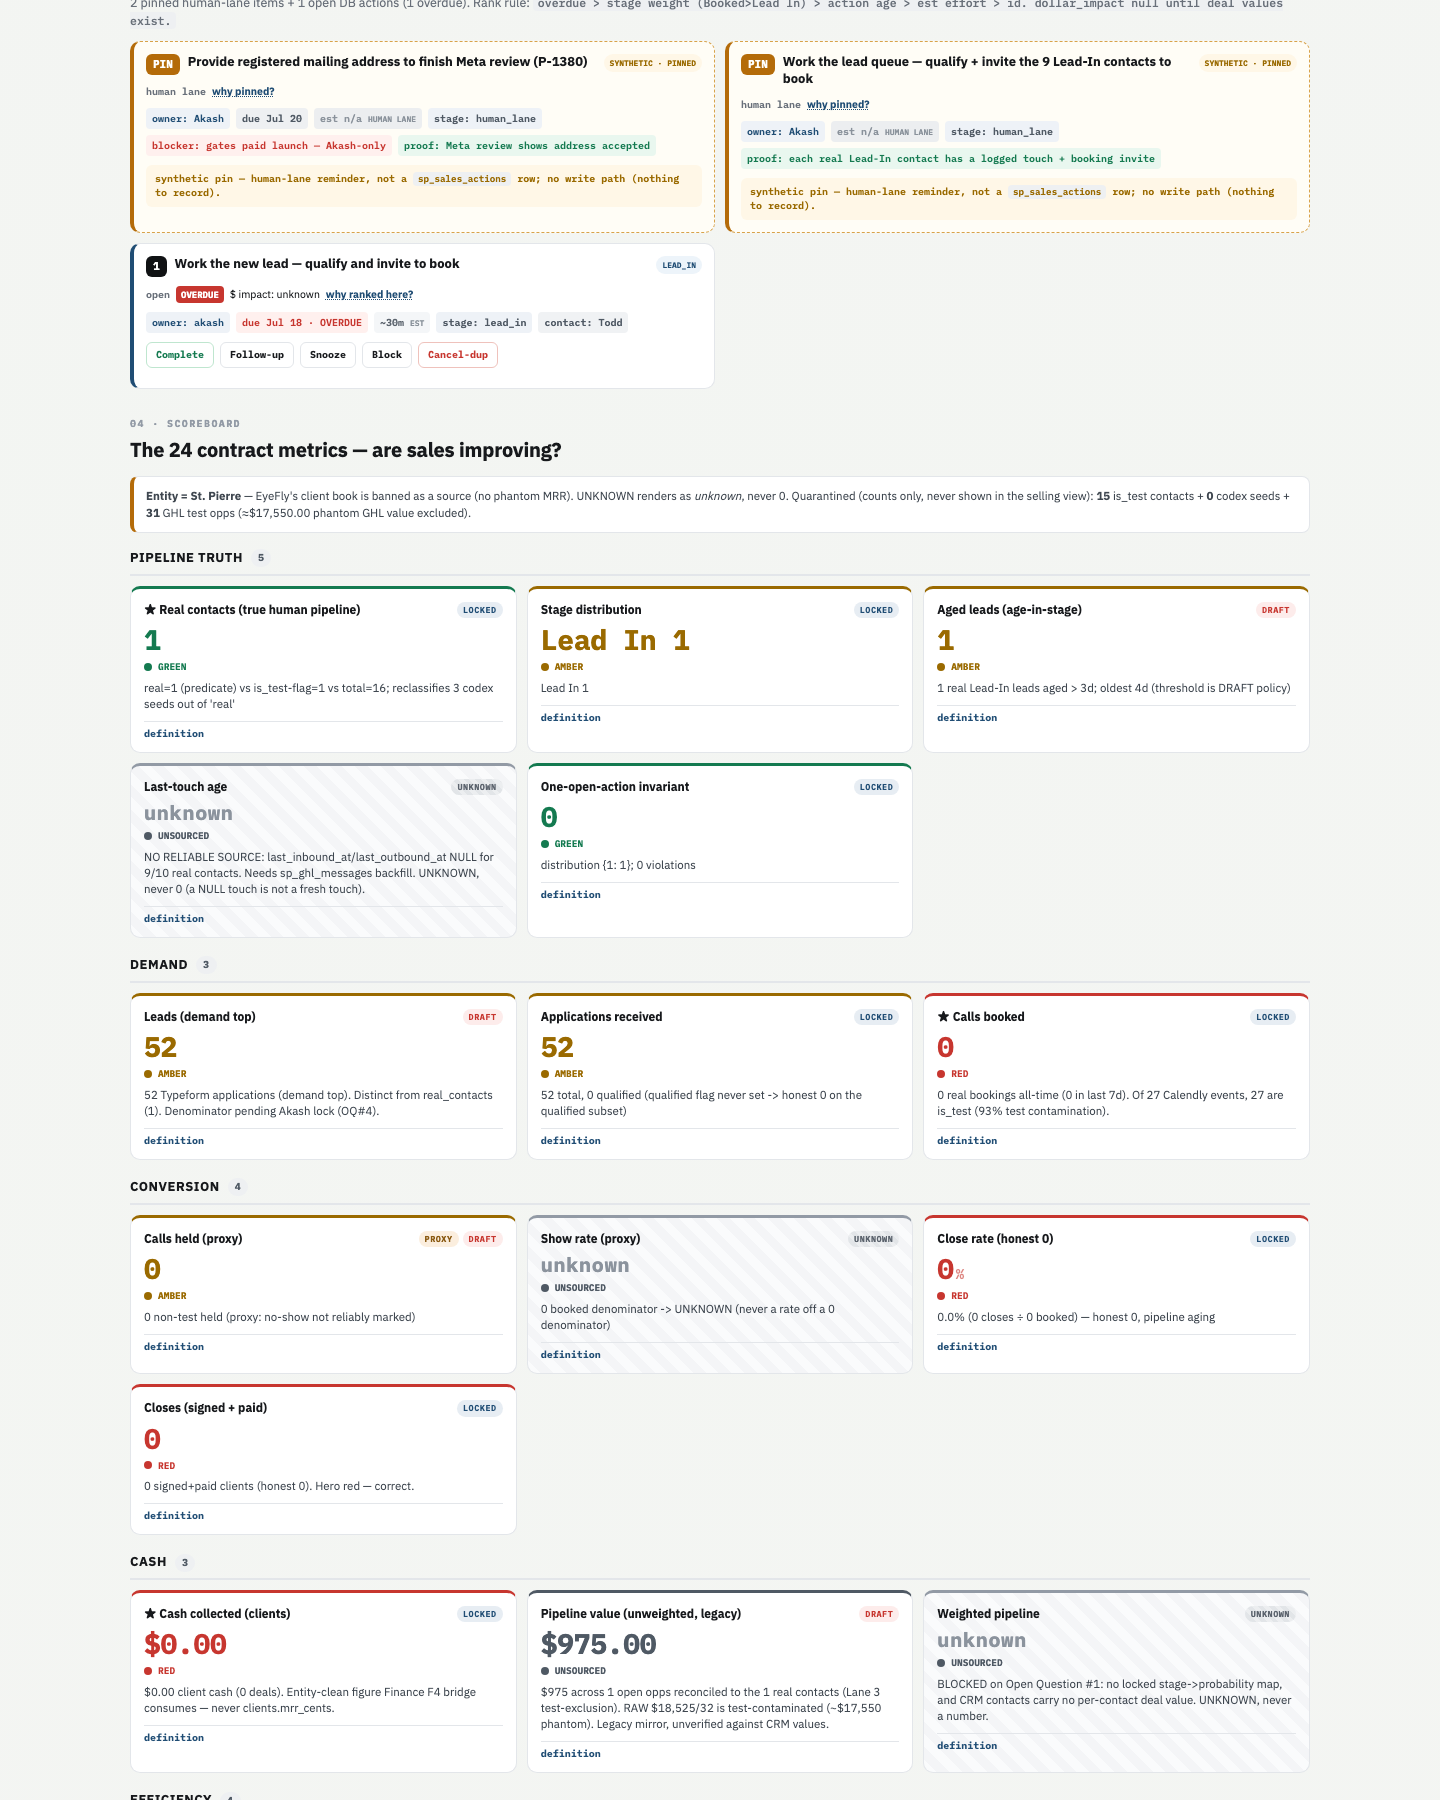
How to read itA ranked action queue. Rank rule: overdue > stage weight (Booked > Lead In) > action age > effort. Yellow "PIN" cards are human-lane reminders (no database write path); the black-numbered card is a real actionable row.
What we see right nowTwo pinned human-lane items ("Provide registered mailing address to finish Meta review (P-1380, due Jul 20)" and "Work the lead queue"). One real ranked card: "Work the new lead — qualify and invite to book," contact Todd, stage lead_in, OVERDUE (due Jul 18), ~30m, $ impact unknown.
What to look forAny card marked OVERDUE in red is the priority. Today: Todd's card is overdue — the single real selling action on the board.
04 · Scoreboard (24 contract metrics)
shots/sales-command-center-s03.png
Sales command center scoreboard
How to read it24 metrics grouped into Pipeline truth, Demand, Conversion, Cash, Efficiency, Safety/health. Each tile shows a value, band color, status word, and a state tag: LOCKED (ratified), DRAFT (unproven), UNKNOWN/UNSOURCED (no source → renders "unknown," never 0), PROXY (stand-in). A ★ marks the group headline.
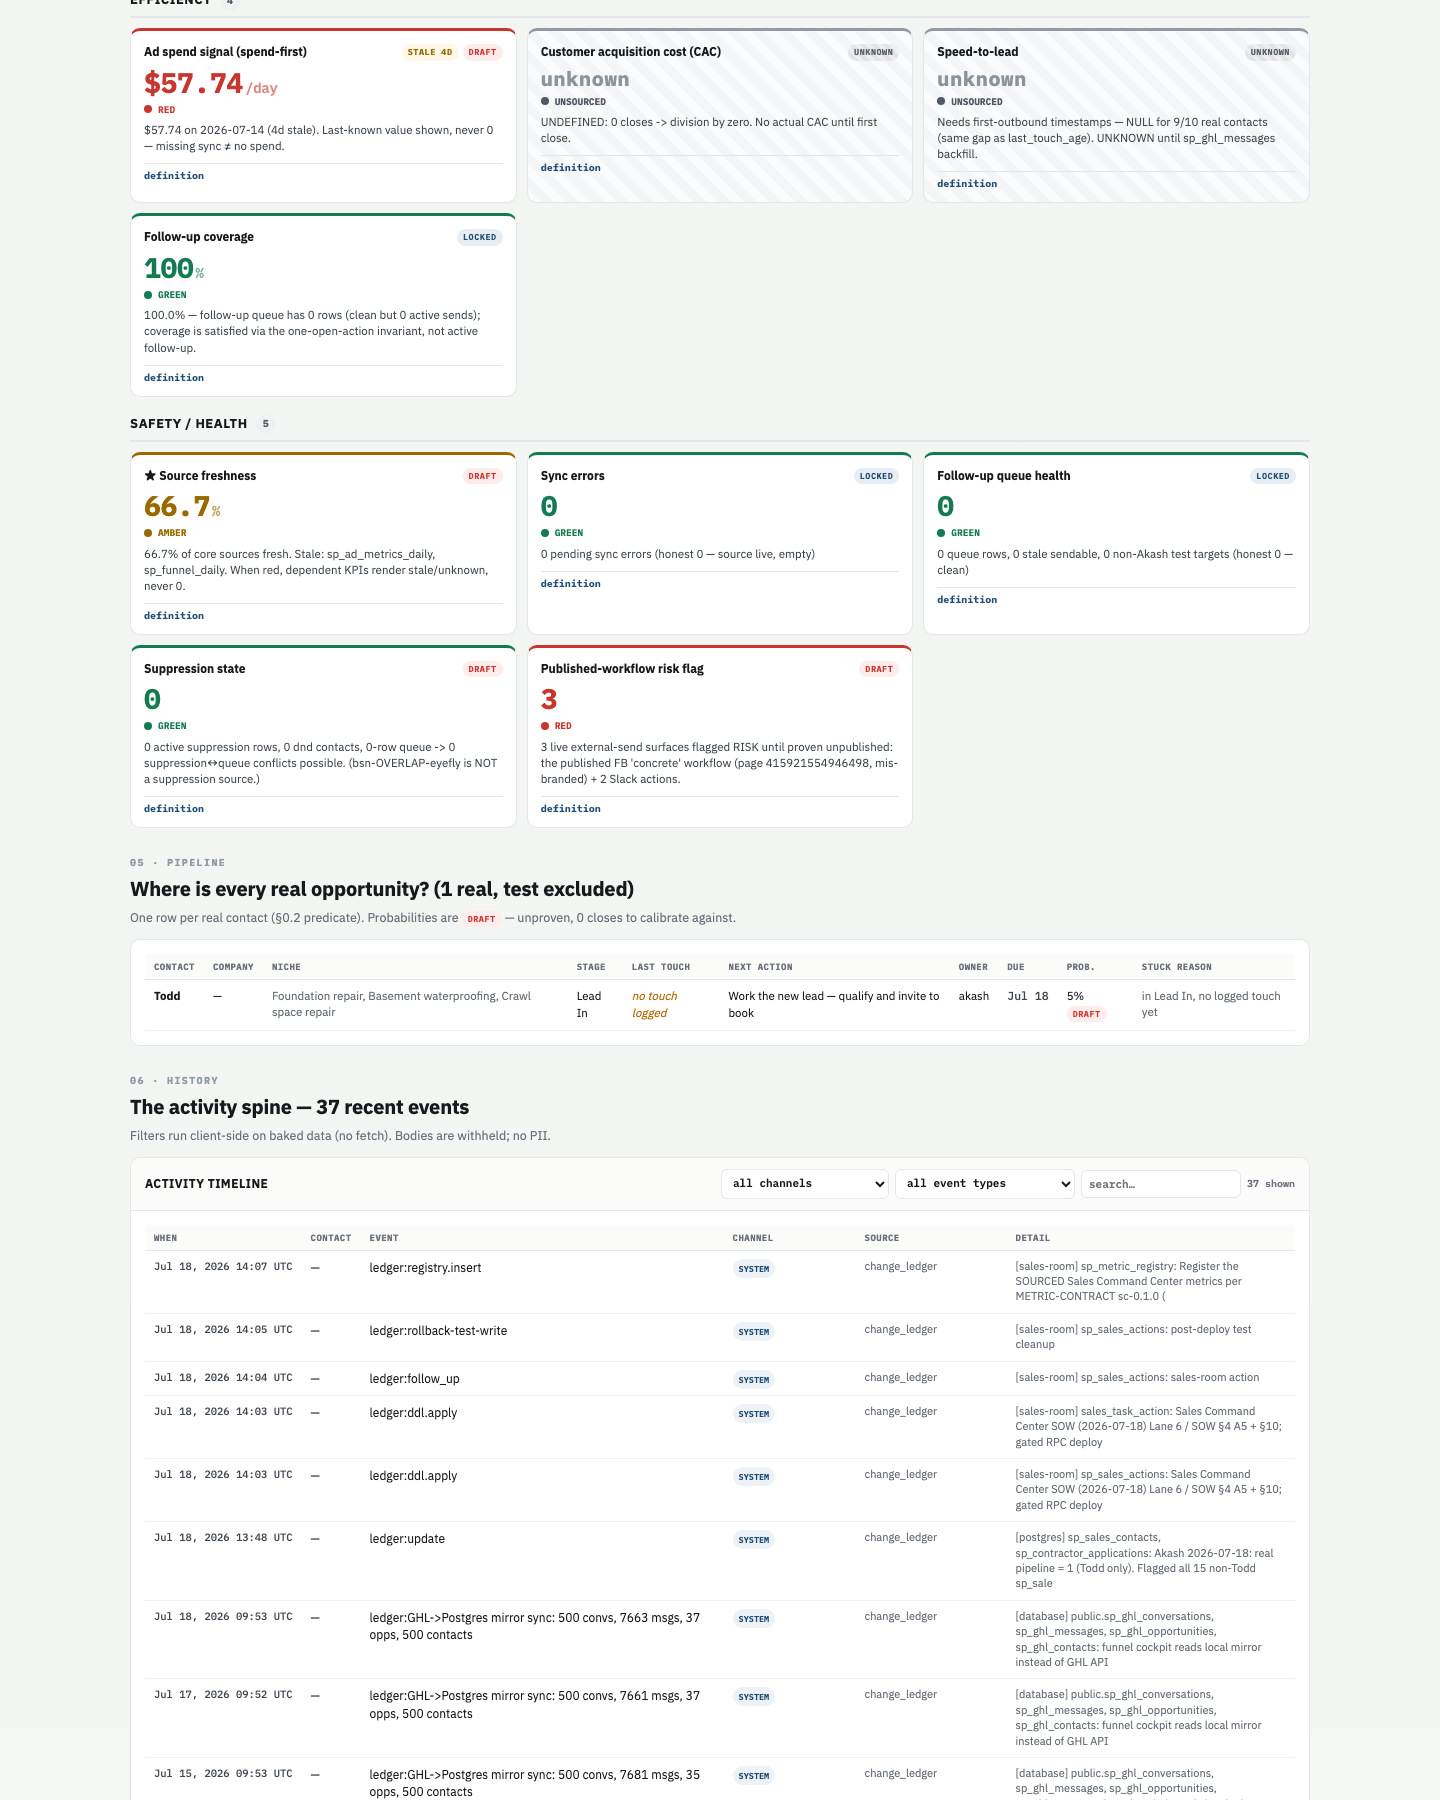
What we see right nowPipeline truth: ★Real contacts 1 GREEN; Aged leads 1 AMBER (oldest 4d); Last-touch age unknown UNSOURCED. Demand: Leads 52 AMBER (Typeform apps); Applications 52 (0 qualified); ★Calls booked 0 RED (93% test contamination). Conversion: Calls held 0 AMBER (proxy); Show rate unknown; Close rate 0% RED; Closes 0 RED. Cash: ★Cash collected $0.00 RED; Pipeline value $975 DRAFT; Weighted pipeline unknown (BLOCKED on the unlocked stage→probability map). Efficiency: Ad spend signal $57.74/day STALE 4d RED; CAC unknown (0 closes); Speed-to-lead unknown; Follow-up coverage 100% GREEN. Safety: ★Source freshness 66.7% AMBER; Sync errors 0 GREEN; Published-workflow risk flag = 3 RED (mis-branded FB "concrete" workflow + 2 Slack actions).
What to look forGREEN ★ = trustworthy. Watch the RED ★s: Calls booked (0) and Cash collected ($0). Published-workflow risk = 3 (RED) is the sleeper danger — three surfaces could fire sends behind the room's back; prove them unpublished. Anything UNKNOWN is a plumbing gap (mostly the sp_ghl_messages backfill + unlocked stage-probability map), not a zero.
05 · Pipeline
How to read itOne row per REAL contact (test excluded). Columns: contact, company, niche, stage, last touch, next action, owner, due, close prob, stuck reason.
What we see right nowExactly one row — Todd, niche Foundation repair / Basement waterproofing / Crawl space repair, stage Lead In, last touch "no touch logged," next action "work the new lead," owner akash, due Jul 18, close prob 5% DRAFT, stuck reason "in Lead In, no logged touch yet."
What to look forA one-row pipeline is the whole reality check. The action is to log a touch on Todd and book a call.
06 · History & 07 · Sources & memory
shots/sales-command-center-s04.png — history + sources
Sales command center history/sources
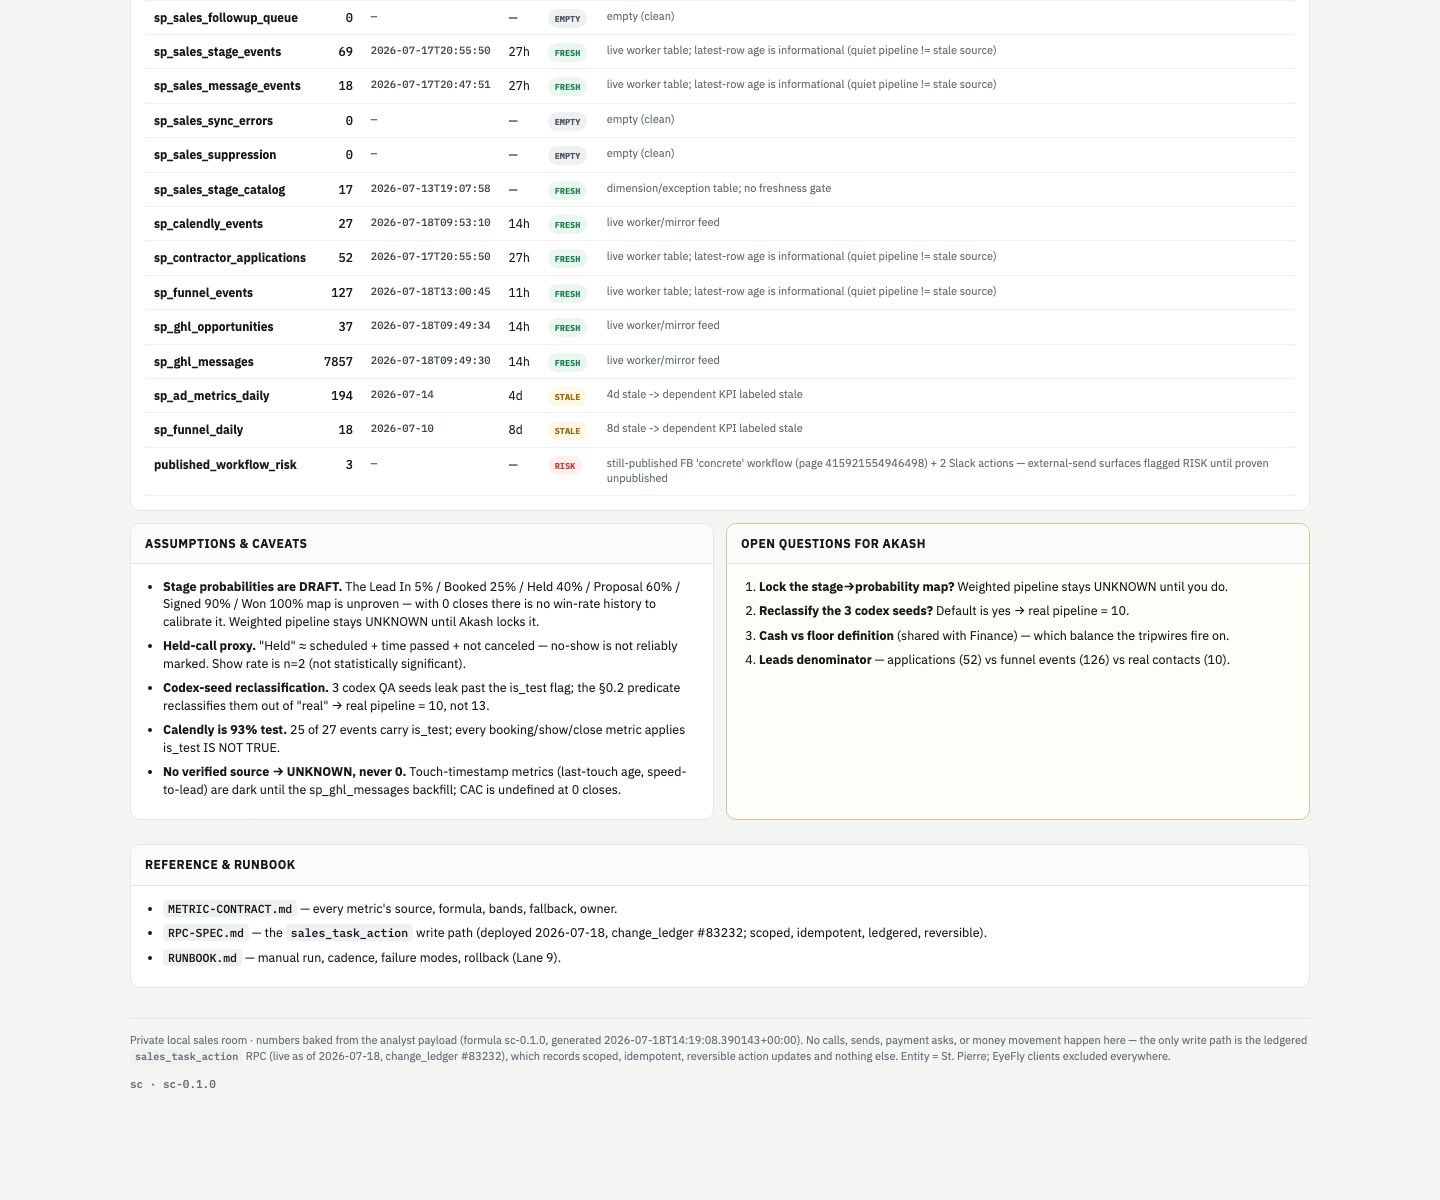
shots/sales-command-center-s05.png — sources & open questions
Sales command center sources
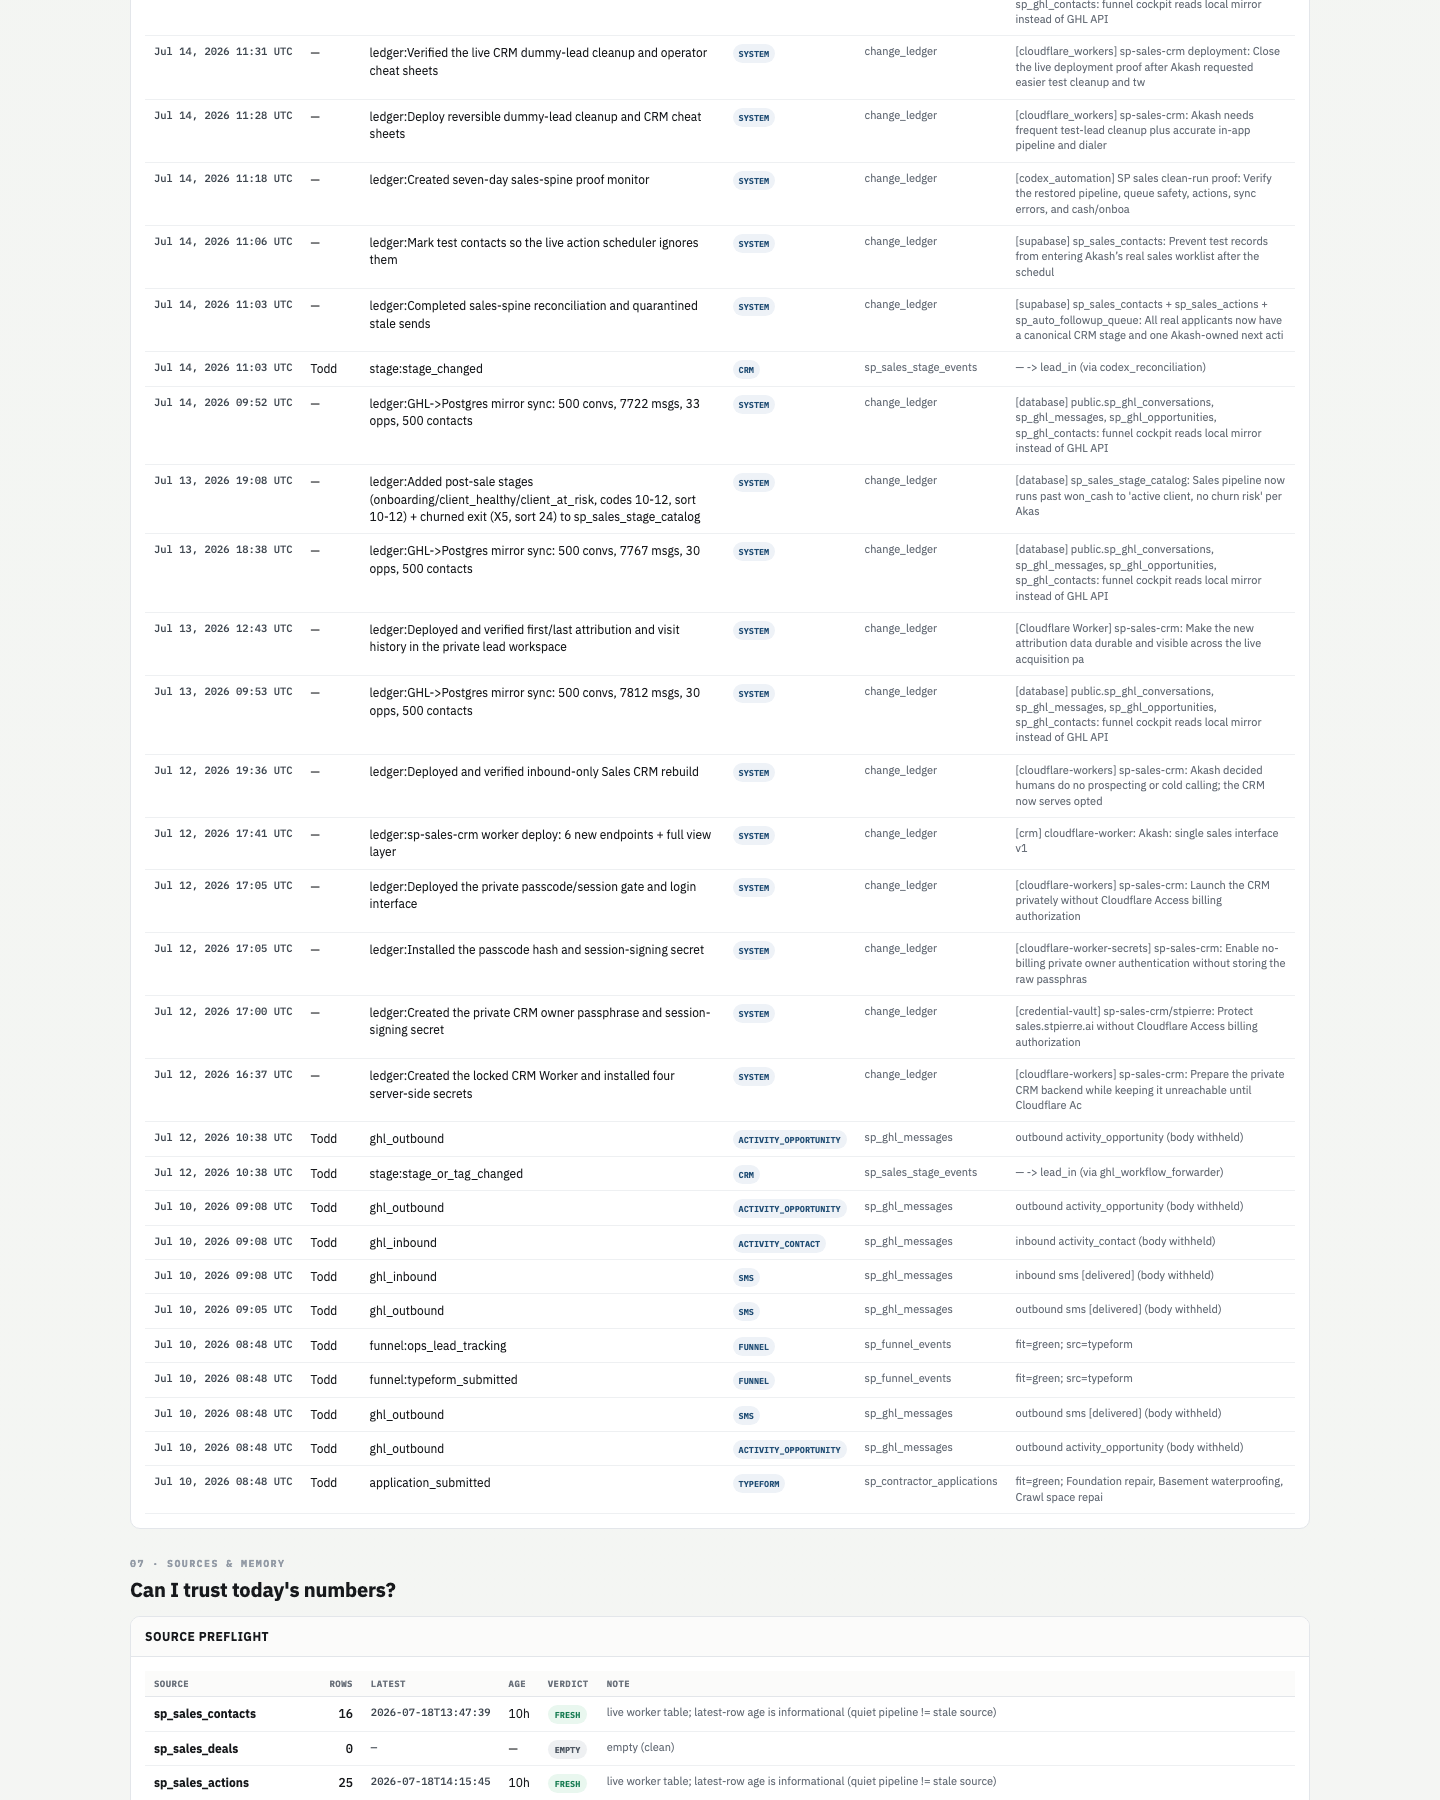
How to read itHistory: a 37-event timeline with filters; bodies withheld (no PII). Most rows are system/ledger events; a handful are real Todd activity. Sources: a preflight table (each feed with rows, latest timestamp, age, verdict), plus assumptions, open questions, and a runbook list.
What we see right nowReal customer events are all Todd, ending Jul 12; everything after is plumbing (mirror syncs, CRM rebuilds, the Jul-18 "real pipeline = 1" reconciliation). FRESH: sp_ghl_messages (7,857), sp_funnel_events (127), sp_contractor_applications (52), sp_calendly_events (27), sp_ghl_opportunities (37), sp_sales_contacts (16). EMPTY (clean): sp_sales_deals (0). STALE: sp_ad_metrics_daily (4d), sp_funnel_daily (8d). RISK: published_workflow_risk (3). Open questions for Akash: (1) lock the stage→probability map; (2) reclassify the 3 codex seeds (yes → real pipeline = 10); (3) cash-vs-floor definition; (4) leads denominator — 52 apps vs 127 funnel events vs 1 real contact (this blocks RPL).
What to look forUse History to confirm a claimed touch happened (last real Todd event is Jul 12 — quiet for a week). STALE feeds = tiles that are last-known, not live. The four open questions are Akash-only decisions; the leads-denominator one is the blocker for RPL.
Sunday Sales Brief RECLASSIFY LOCAL weekly "one call" report

What it is: a once-a-week, ~5-minute read pointing at the single call that moves the number this week. Status: LOCAL sunday-brief-2026-07-18.html, generated Jul 18 for the week of Jul 13 — a dated one-off, not self-updating. When to open: Sunday/Monday. Hero check: NO — a black tile (1 real open deal · $49 draft weighted value). Verdict: RECLASSIFY → reports shelf; it duplicates the Command Center's data.

Full brief
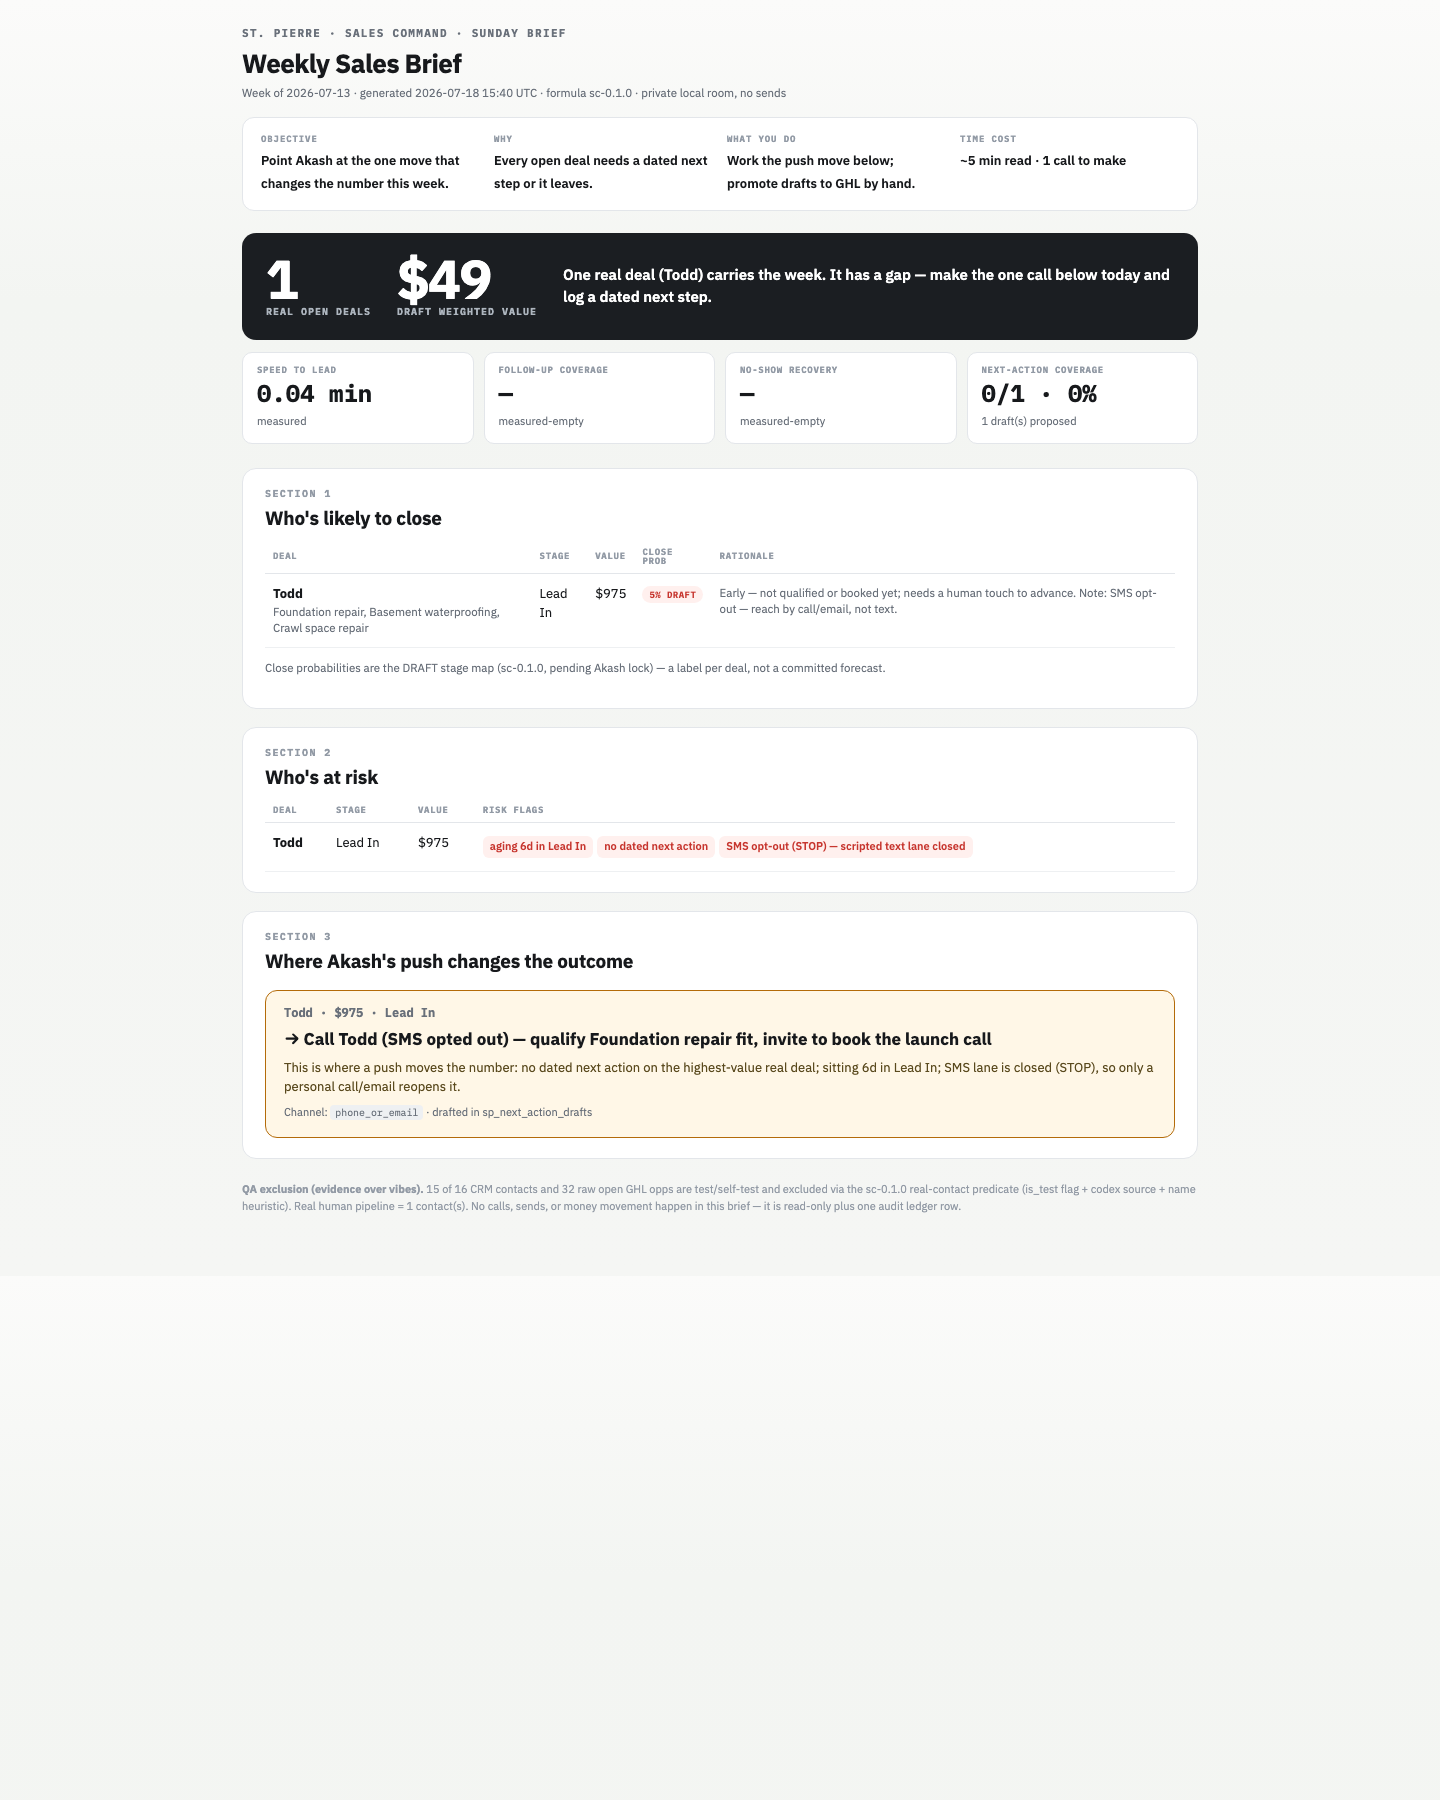
shots/sunday-sales-brief-s01.png
Sunday sales brief
How to read itHeader row (Objective / Why / What you do / Time cost), a hero tile, four metric tiles, then Section 1 "Who's likely to close," Section 2 "Who's at risk," Section 3 "Where Akash's push changes the outcome," and a QA-exclusion footnote.
What we see right nowHero: 1 real open deal, $49 draft weighted value ("One real deal (Todd) carries the week"). Tiles: Speed to lead 0.04 min, Follow-up coverage —, No-show recovery —, Next-action coverage 0/1 · 0%. Section 1: Todd, Lead In, $975, 5% DRAFT close prob, "SMS opt-out — reach by call/email." Section 2: Todd aging 6d, no dated next action, SMS opt-out (STOP). Section 3: → "Call Todd (SMS opted out) — qualify Foundation repair fit, invite to book the launch call" (phone_or_email). Footnote: 15 of 16 CRM contacts + 32 raw GHL opps excluded as test; real human pipeline = 1.
What to look forThe brief is doing its job — it isolates the one lever (call Todd by phone/email because SMS is STOP). Red flag baked in: "$49 draft weighted value" is 5% DRAFT applied to $975 — not a forecast. The hero should label "weighted (draft)" more loudly.

Confusing bits to fix (the wife test)

  • RPL / CPQL — the room is named for RPL but the term never appears on either screen; define it and show it.
  • UNPROVEN / "honest 0" / "unknown, never 0" — one sentence up top: "0 = we checked, it's really zero. unknown = no trustworthy source yet."
  • DRAFT / LOCKED / PROXY / UNSOURCED / UNKNOWN badges — five state tags with no legend.
  • is_test / codex seeds / "real=1 vs 16 raw" — say plainly: "we hide fake/test rows; only 1 of 16 contacts is a real human."
  • STOP / SMS opt-out / DND / suppression — explain the customer legally can't be texted; reach by phone/email.
  • GHL, CRM, Typeform, Calendly, P-1380, sp_ghl_messages backfill — tool/ticket names with no gloss.
  • "Weighted pipeline" / "5% DRAFT" / "$49 draft weighted value" — label "unproven estimate — not a forecast."
  • Deadline colors (red ≤2d / amber ≤5d) — make the band legend global, near the tiles that reuse the colors.
  • Source freshness 66.7% / STALE 4d–8d — add: "yellow source = the number below may be a few days old."
  • "Published-workflow risk = 3" — the scariest tile; spell out what the 3 surfaces are and what "prove unpublished" means.
  • Two different scorecards (24 here vs 25 company-wide) — tell the reader which is authoritative.

7 · 📦 Fulfillment Room

The room in plain English

This room answers one question: once a client has paid, are we actually delivering what we promised? stpierre.ai sells contractors a guarantee — a set number of leads (and booked inspections) per month. Fulfillment turns "cash collected" into "client stays happy and renews."

Three surfaces: one real dashboard (the Client Delivery Board, one row per each of 40 active clients) and two step-by-step playbooks (the 6-week install SOP and the Week-1 runbook) that are documents, not dashboards.

The stated hero is clients on guarantee pace — exactly right. The problem: there's no data behind it. All 40 clients show "no guarantee set" because nobody entered each client's monthly lead target, and the board never joins in leads actually delivered. So the hero renders blank across the board. The one live metric that matters is booked appointments (inspections booked) — 7/week, the "$200 money metric."

Room KPI recommendation

Core company KPI this room feeds: MRR retention — specifically churn (churned-clients / churned-MRR).

  • 1. % clients on guarantee pace (hero)not tracked. Target field NULL for 40/40 clients; the board doesn't compute pace. Fixing it is the #1 recommendation.
  • 2. Booked appointments / inspections per weektracked (7/wk, the "$200 money metric").
  • 3. At-risk clientspartial. Renders, but sources disagree (scorecard says 1, delivery board shows 2).

Note: inspections delivered (vs booked) is NOT TRACKED ANYWHERE — if the guarantee is written on delivered inspections, that feed must be built before the hero can be trusted.

Consolidation verdict

DashboardVerdictWhy
Delivery BoardKEEPThe only true dashboard here; the correct spine — one row per client with health, retention, pace.
Install SOPRECLASSIFYA 6-week playbook, not a dashboard; currently a dead EyeFly link. Retire or rehost as a doc.
Week-1 RunbookRECLASSIFYAn onboarding checklist; banned "St. Pierre Digital" name in title. Merge with Install SOP.
Redundancy inside this room: the two playbooks overlap heavily (Week-1 covers signature → end of Week 1; Install SOP extends to 6 weeks). Merge into one "New-Client Install Playbook." The delivery board is the only surface with numbers, so the consolidation win is moving both SOPs out of the dashboard list.
Client Delivery Board KEEP LOCAL one row per active client

What it is: a one-row-per-client health board for all 40 active clients — health tier, retention risk, open tickets, and (when wired) whether they're hitting their lead guarantee. Status: LOCAL, generated 2026-07-18 15:46 UTC (~1 day old), "LOCAL, not deployed." Source: Postgres clients + client_health + support_tickets. When to open: every morning; scan the at-risk rows first. Hero check: No — a row of count tiles. Should trend % on guarantee pace + at-risk count, but that history has to be built first. Verdict: KEEP — fix the guarantee-pace feed, then add the hero line.

Header + count band
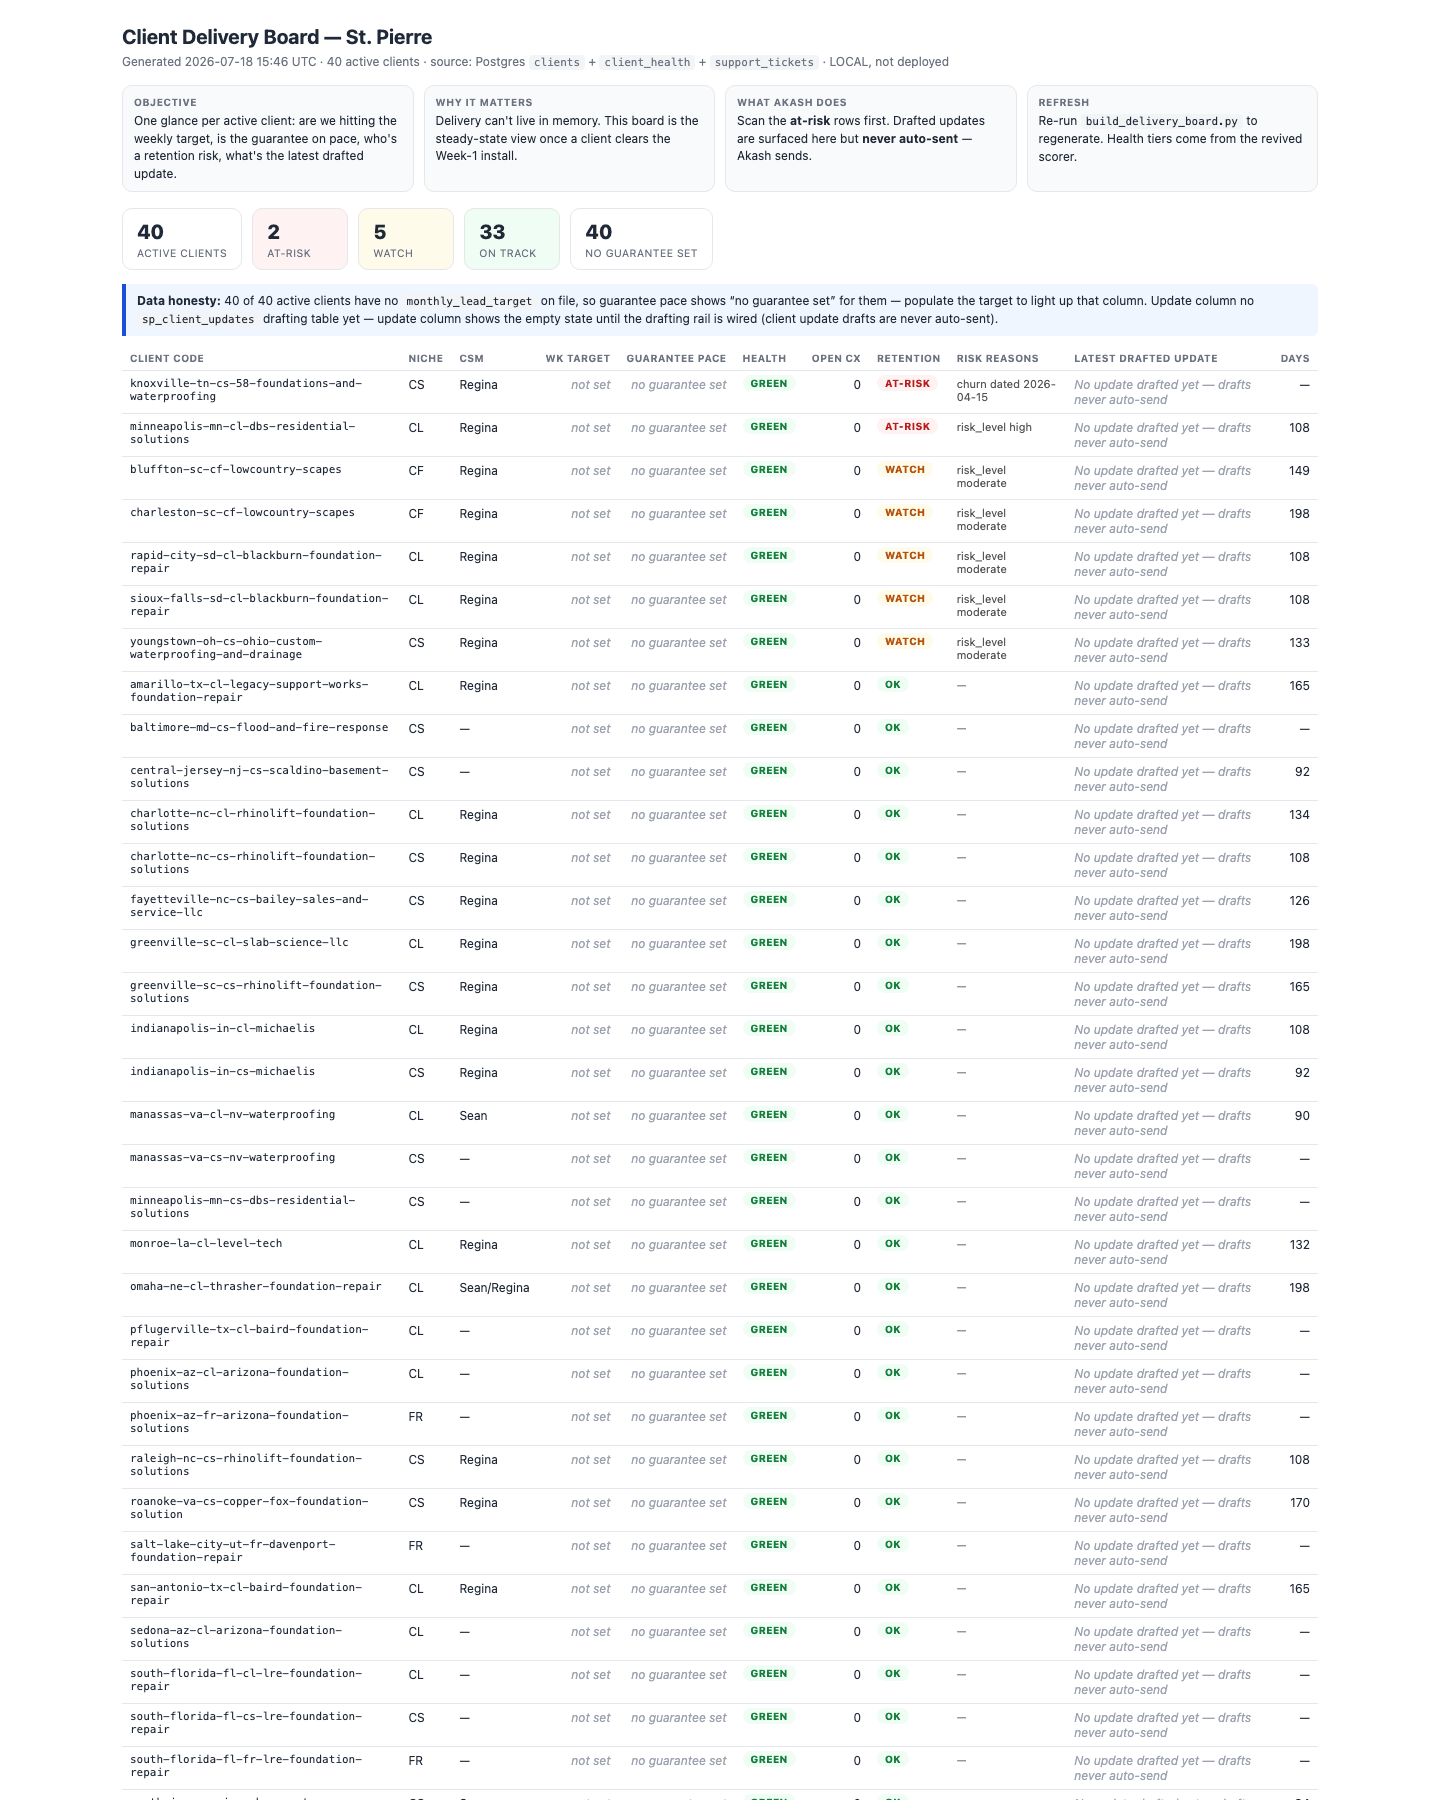
shots/delivery-board-s01.png — count band + client rows (top)
Delivery board top
How to read itFour grey cards at top are a built-in legend (Objective / Why / What Akash does / Refresh). Below is the count band: five tiles summarizing all 40 clients by health tier. The blue "Data honesty" note is the board telling on itself about what's missing.
What we see right now40 active clients. 2 at-risk, 5 watch, 33 on track. The loud one: 40 of 40 show "no guarantee set." The honesty note says every client has no monthly_lead_target, so the guarantee-pace column is blank for everyone; and there's no sp_client_updates table yet, so "latest drafted update" is empty for everyone too. Two whole columns are placeholders.
What to look forGreen flag = at-risk trending down. Red flag = the "no guarantee set" tile staying at 40 (the room hero has zero data — populate each client's monthly_lead_target). Red flag = at-risk climbing (open those rows, check risk reasons).
Client rows (top + bottom half)
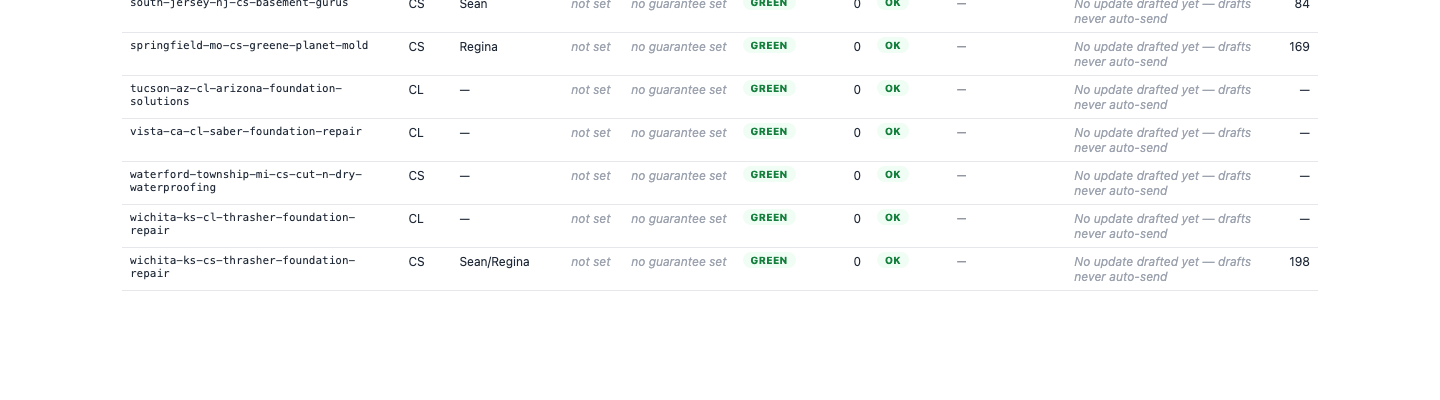
shots/delivery-board-s02.png — client rows (bottom half)
Delivery board bottom
How to read itOne row per client. Columns: Client code (city-state-niche-business slug) · Niche (CS / CL / CF / FR two-letter codes) · CSM (client success manager, or "—") · Wk target · Guarantee pace · Health pill · Open cx (open support tickets) · Retention (OK / WATCH / AT-RISK) · Risk reasons · Latest drafted update · Days (in delivery).
What we see right nowThe two AT-RISK rows to act on: knoxville-tn-cs-58-foundations-and-waterproofing (Regina) with risk reason "churn dated 2026-04-15", and minneapolis-mn-cl-dbs-residential-solutions (Regina) with "risk_level high." Five WATCH rows are "risk_level moderate" (both Lowcountry Scapes, both Blackburn, youngstown-oh). Notably every client's Health pill is GREEN even the two at-risk ones — Health and Retention are two different scores that can disagree. Wk target / Guarantee pace read "not set" / "no guarantee set" on every row. Many clients have no CSM ("—"). The healthy tail (south-jersey, springfield, tucson/vista/wichita, waterford) is all GREEN / Retention OK / 0 open cx. Days-in-delivery range 84–198.
What to look forRed flag = an AT-RISK row — read its reason and act. The knoxville row is a data-hygiene red flag: a churn date of 2026-04-15 (three months ago) yet still counted active — either it churned and shouldn't be in the 40, or the date is stale. Green flag = Retention OK + 0 open cx. Watch flag = an unassigned ("—") client sliding into WATCH with nobody accountable.
Install SOP RECLASSIFY DEAD LINK 6-week install playbook

What it is: a 6-week, day-by-day install playbook for onboarding a newly-signed contractor. Status: LIVE (nominally) at eyefly-sp-install-sop.pages.dev — but the page fails to load: "This site can't be reached — DNS_PROBE_STARTED." The URL is also EyeFly-branded. Verdict: RECLASSIFY → docs/library. Retire or rehost on a stpierre.ai surface.

Page load failure
shots/install-sop-s01.png — browser error page
Install SOP dead link
What we see right nowChrome "This site can't be reached — eyefly-sp-install-sop.pages.dev's DNS address could not be found. DNS_PROBE_STARTED." The Cloudflare Pages project appears deleted or never re-deployed. No SOP content is viewable.
What to look forRed flag = a "LIVE dashboard" that DNS-fails is worse than a local file — it looks trustworthy in a link list but delivers nothing. Action: remove from the registry; rehost as a doc if the content is still wanted.
Week-1 Runbook RECLASSIFY LOCAL Day-1-through-Week-1 checklist

What it is: an executable Day-1-through-Week-1 onboarding checklist a pod follows the day a contractor signs — capacity gate, then Phases 0–5. Status: LOCAL, P-0770, v1, dated 2026-07-10 (static process doc). Verdict: RECLASSIFY → docs/library. Merge with Install SOP; and fix the title: it says "St. Pierre Digital," a banned name.

Header + capacity gate + phase list
shots/week1-runbook-s01.png
Week-1 runbook
How to read itTop four cards frame the doc. The big yellow box is a capacity gate: stpierre.ai fronts ~$585/week per client in delivery cost (~$487 ad spend + ~$100 for the AI qualifier "Jean"), so only 2 concurrent Week-1 installs are allowed; a 3rd signature waitlists. Below are collapsible phases 0–5, tagged "NEEDS YOU" or "REFERENCE."
What we see right nowTitle reads "Week-1 Fulfillment Runbook — St. Pierre Digital" (banned name). Capacity math: 1 client ~$585/wk, 2 (the cap) ~$1,170/wk, 3 ~$1,755/wk = blocked. Phase 0 expanded (capacity gate → brain pre-check → collect 3 inputs: business name, niche CL/CF/FR/CS, market). Default client budget $1,500/mo. References the onboarding skill spine.
What to look forThe insight is structural: the 2-client concurrency cap is a real fulfillment constraint the delivery board does NOT surface — nowhere can you see how many clients are mid-install vs steady-state, or whether a signature is being waitlisted. Red flag on the doc itself: the banned company name in the title.

Confusing bits to fix (the wife test)

  • Niche codes CS / CL / CF / FR are never defined — add a one-line key (e.g. CS = crawl space, FR = foundation repair; confirm the real mappings).
  • "Guarantee pace" is blank for 100% of clients — the room hero reading blank needs a louder callout: "⚠️ Room hero has NO data — targets not entered."
  • Health vs Retention contradict each other — both at-risk clients show GREEN health next to AT-RISK retention. Explain what each measures and which wins.
  • "Open cx" is unexplained — should say "open support tickets."
  • "Days" column has no header explanation, and some rows show "—" with no reason.
  • "No update drafted yet" on every row looks like 40 pending to-dos but is the empty state of an unbuilt feature — build it or hide the column.
  • CSM shown as "—" on many rows — is that unassigned or N/A? Many clients have no success manager, itself a finding.
  • Knoxville churn date in the past (2026-04-15) still counts as active — reconcile.
  • install-sop link is dead and week1-runbook title says "St. Pierre Digital" — both erode trust in the link list.
  • The 2-client install concurrency cap is invisible on the delivery board — a newcomer would never know onboarding is capacity-gated.

8 · 🏗️ Projects Room (general / capex / infra)

The room in plain English

This is the "are we building the machine, and can we keep the lights on while we do it?" room. It tracks the Project pipeline — the builder's side, where every unit of work is a numbered outcome (a thing that ships), not a person. Akash owns people and money; this room owns the build.

The one board that earns its keep is the Cockpit — the daily "what needs attention today?" entry point that fuses runway, the day's work blocks, habits, and the big finish lines. The rest is noise: two "project board" surfaces (project-check and projects-deployed) are the same page rendered twice and both show zero projects (a data lockout, not an empty business), and three more (infra-backlog, builder-onboarding, execution-pack) are documents, not dashboards.

Room KPI recommendation

Core company KPI this room feeds: Runway (weeks) = net cash ÷ weekly burn. This room is where money gets spent to build, not earned.

  • 1. Infrastructure completion %not tracked. Lives only as hand-typed percentages in the infra-backlog SOW (7 layers averaging ~60%).
  • 2. Active projects with a dated next actionpartial. The projects table has a next_action column, but the board that reads it is RLS-locked and renders 0.
  • 3. Numbered outcomes shipped / weeknot tracked. Derivable from handoffs/deliverables, but nothing rolls it into a weekly count.

Note: the live 25-metric scorecard has no builder / Project-pipeline lane at all. And Cash OS runway has no history to plot (1 row) — the cockpit's runway line is a projection off one baked point until a snapshot series is wired.

Consolidation verdict

DashboardVerdictWhy
CockpitKEEPThe room hero and daily entry point; only board here rendering live, useful data.
Project CheckCONSOLIDATERenders 0 projects (RLS lockout). Cockpit's "finish lines" already shows this data live.
Projects DeployedDEPRECATEByte-identical public mirror of Project Check; also empty. A second copy of a broken page.
Infra BacklogRECLASSIFYA 6-week SOW (build plan with user stories). Not a dashboard.
Builder OnboardingRECLASSIFYAn onboarding doc read once. Not a dashboard.
Execution PackRECLASSIFYA dated one-off execution rollup. Not a dashboard.
Redundancy inside this room: project-check (local) and projects-deployed (the pages.dev mirror) are the same page — same title, same 0/0/0/0 tiles, same timestamp. One board deployed twice, both broken. The cockpit's "what each part is trying to finish" section already surfaces the live project/finish-line data these boards are supposed to show.
Cockpit KEEP LOCAL the daily "what needs attention today" page

What it is: the single morning page — money, the day's work blocks, habits, and the big finish lines on one screen. Status: LOCAL cockpit.html, saved Jul 18 08:32, renders live (stamped Jul 19 4:30 AM). Two freshness flags: (1) the money hero is a baked snapshot stamped "AS OF JUL 17" — 1–2 days stale; (2) the "THIS WEEK" embed is broken (broken-image icon). When to open: every morning, before the 10:30 huddle. Hero check: Partial — opens with a text triage grid, not a line. It has a "TOTAL BALANCE BY DAY" trend lower down (effectively a runway line); promote it to a hero plotting net-cash/runway + daily burn. Verdict: KEEP.

Header + "Where you are right now" + Money check
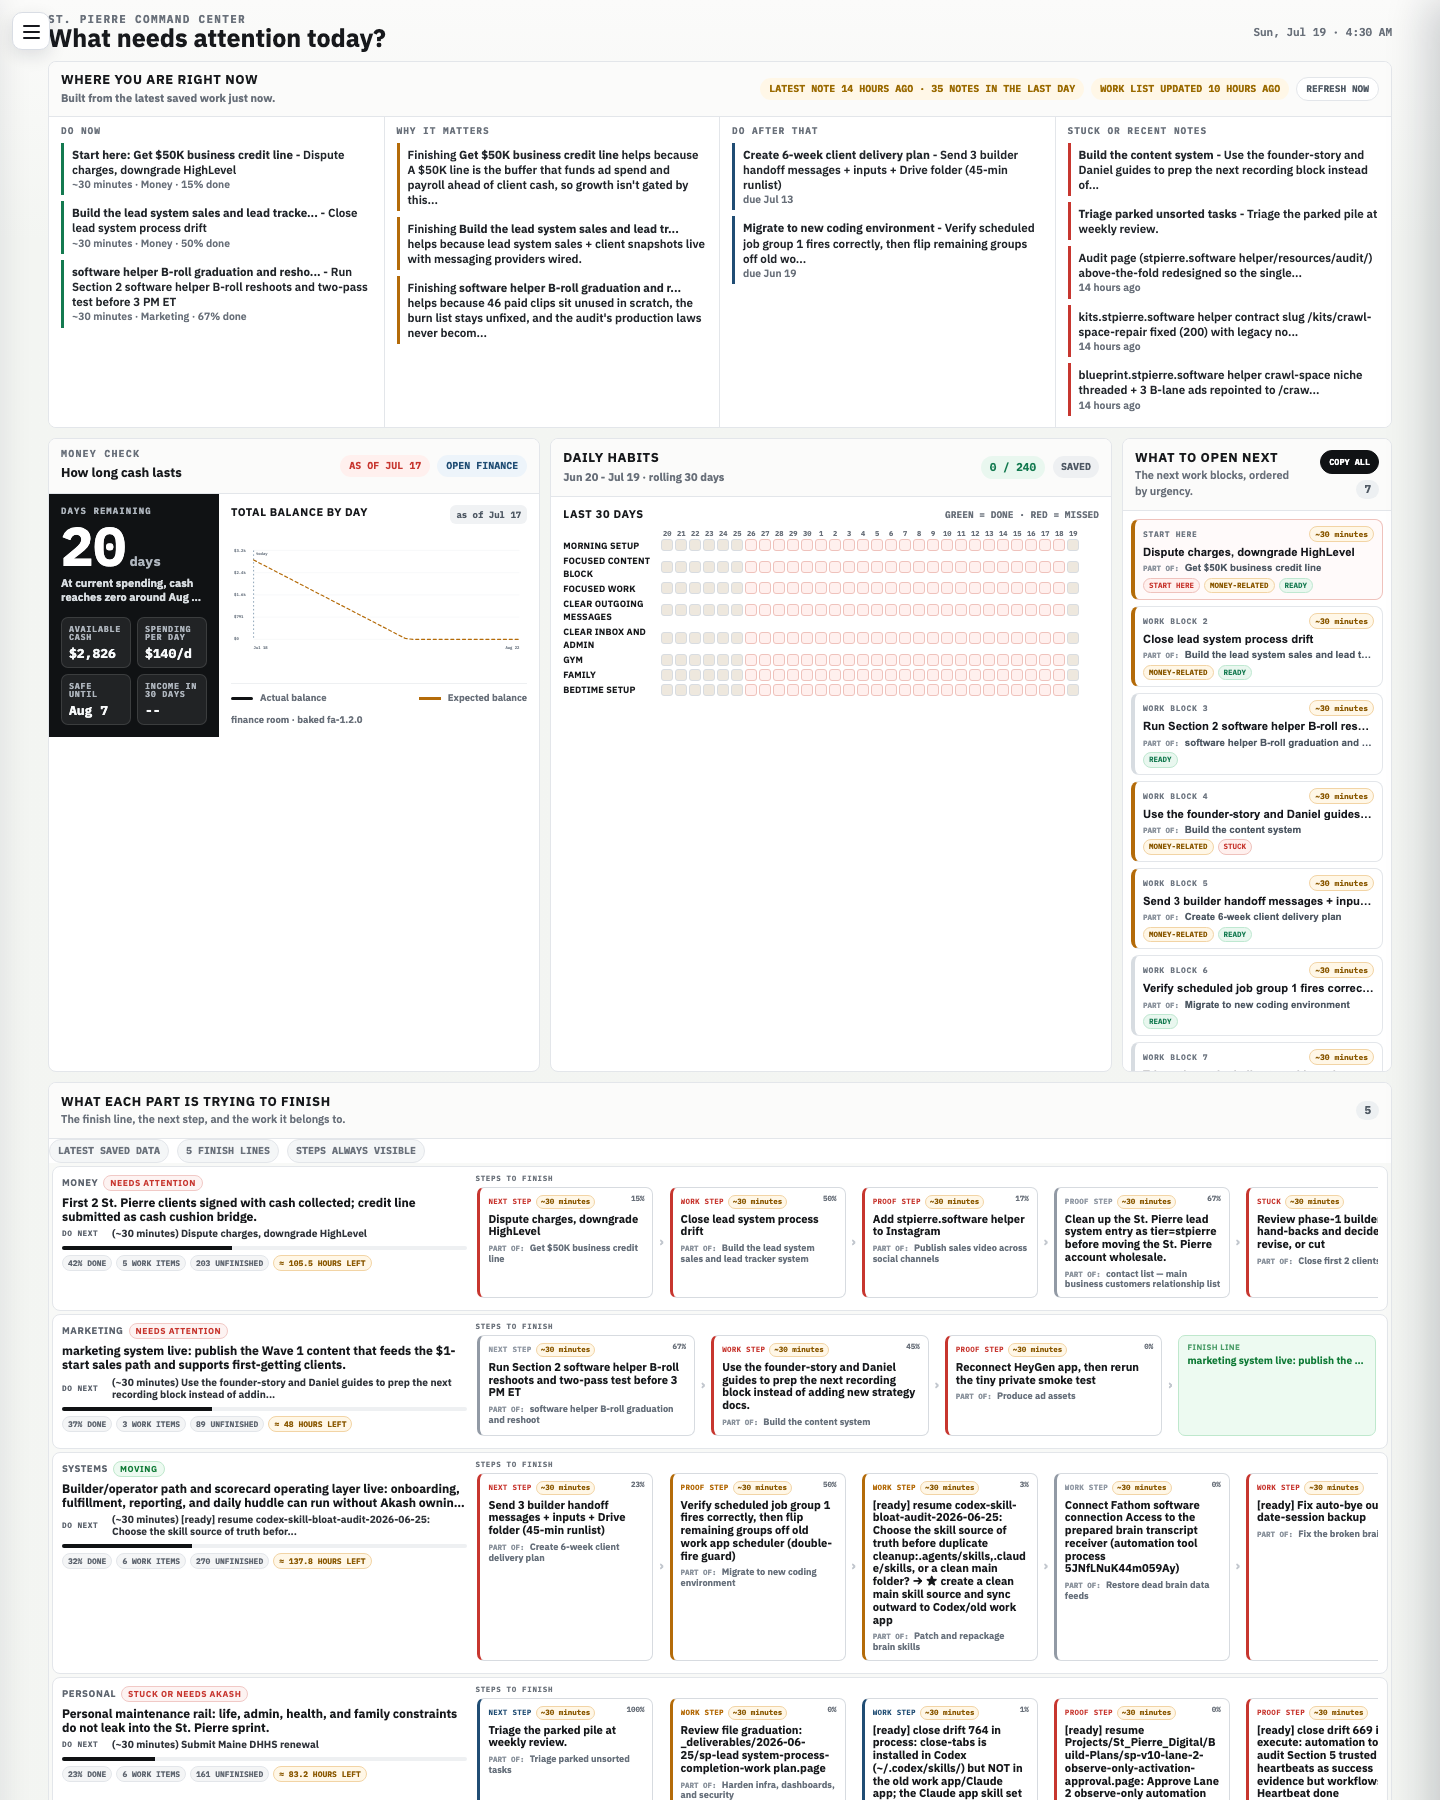
shots/cockpit-s01.png — triage grid, money/runway, habits, blocks
Cockpit main
How to read itThe top strip answers four questions left-to-right: Do now (top 3 tasks), Why it matters, Do after that, Stuck or recent notes. The black tile below is runway: big number = days of cash left; around it Available cash, Spending/day, Safe-until date, Income next 30 days; the chart plots actual vs expected balance forward.
What we see right now"Do now" = Get $50K business credit line (~30 min, Money, 15% done), then Build the lead system (Money, 50%), then Section 2 B-roll graduation (Marketing, 67%). Money check: 20 days remaining, cash reaches zero around Aug 7. Available cash $2,826, spending $140/day, income next 30 days "--" (blank). Under the hood: business cash $2,826.18 vs a $3,202.21 floor — $376 below floor, margin "hot."
What to look forGreen flag = "Do now" items are money/lead with real % progress (they are). Red flag = days-remaining under ~30 or cash below floor (both true — a genuine cash-tight state, not a bug). Red flag = Income-30-days blank makes runway look worse than reality if income is coming; wire expected income.
Daily habits + What to open next
How to read itA 30-day grid of personal routines (green = done, red = missed, grey = no data), with a "0 / 240" completed counter. Then an ordered queue of ~30-minute work blocks, most-urgent first, tagged START HERE / MONEY-RELATED / READY / STUCK.
What we see right nowHabits: 0 / 240 saved, grid almost entirely grey — habits aren't being logged, not that every one was missed. Blocks: 7 total. Block 1 (START HERE) = Dispute charges, downgrade HighLevel (part of Get $50K credit line). Blocks 2–7 run through lead-system drift, B-roll reshoots, the founder-story content build (STUCK), builder handoffs, and a coding-environment migration.
What to look forA wall of grey habits = the tracker is dead; start logging or hide the panel. Green flag = the top block is money-tagged and READY (it is). Red flag = a STUCK block at the top of the queue blocking everything under it.
What each part is trying to finish (finish lines) + broken embed
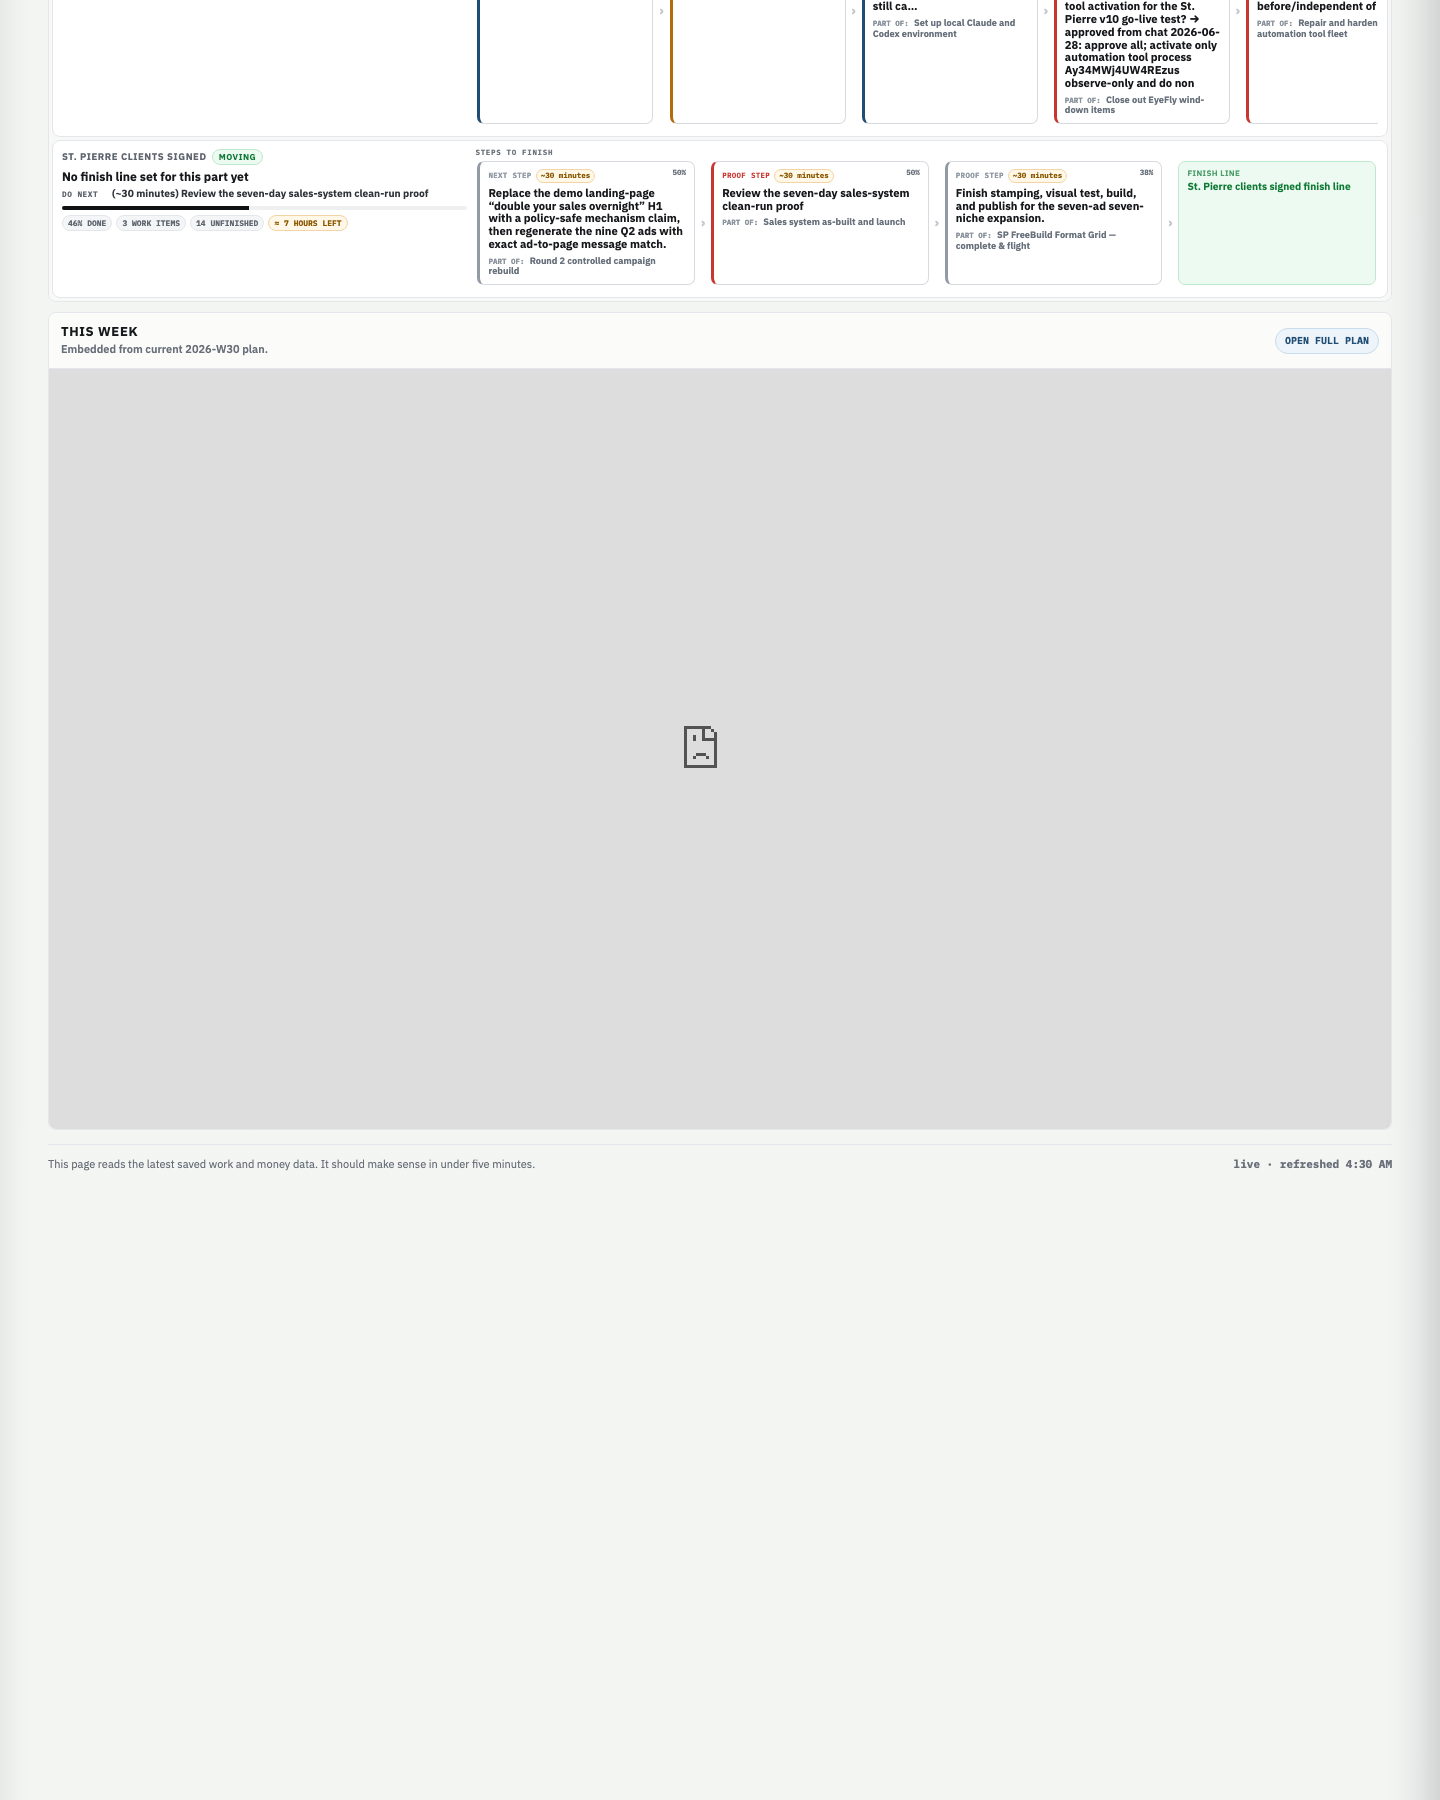
shots/cockpit-s02.png — finish lines + the broken "This week" embed
Cockpit finish lines
How to read itOne row per life/business "part" (Money, Marketing, Systems, Personal, St. Pierre-clients). Each shows a status chip (NEEDS ATTENTION / MOVING / STUCK), a % done bar, work-item count, unfinished count, and estimated hours-left.
What we see right nowMoney — NEEDS ATTENTION, 42% done, 203 unfinished, ~105.5h. Marketing — NEEDS ATTENTION, 37%, ~48h. Systems — MOVING, 32%, 270 unfinished, ~137.8h. Personal — STUCK, 23%. St. Pierre clients — MOVING, 46%, only ~7h left — the closest finish line. The "THIS WEEK" embed shows a broken-image icon — the iframe to the W30 plan failed.
What to look forGreen flag = a part flips to MOVING with shrinking hours (St. Pierre-clients ~7h is the one to close first). Red flag = two+ parts NEEDS ATTENTION at once (Money + Marketing today) — you're spread thin. Red flag = a huge "unfinished" count (203, 270) behind a small % done (under-scoped). The broken embed is a bug to fix or remove — it erodes trust in everything above it.
Project Check CONSOLIDATE BROKEN renders empty (RLS lockout)

What it is: a board meant to list active projects ranked by importance, each with DoD, why-it-matters, cost-of-inaction, next action. Status: LOCAL index.html (file dated Jun 24), renders live "as of Jul 19, 4:31 AM," RENDERED EMPTY. Verdict: CONSOLIDATE → cockpit.

Empty project board
shots/project-check-s01.png
Project check empty
How to read itFour counter tiles — Critical / Important / Someday / Total active — over a search box.
What we see right now0 / 0 / 0 / 0. Confirmed cause: index.html connects with the publishable key and queries the projects table directly. This is the Supabase RLS lockdown pattern — the publishable key is locked out of the raw table, so the query returns zero rows even though projects exist. The cockpit renders fine because it reads different, readable tables (handoffs/signals/finance).
What to look for0 across all tiles on a board that hits a brain table = suspect RLS first, not an empty business. Fix pattern (Jul-18 standard): expose a curated SELECT-only v_dash view and point the board at that, rather than opening anon policies on the base table.
Projects Deployed DEPRECATE BROKEN public mirror of Project Check, also empty

What it is: the public/live copy of the same "St. Pierre — Command Center" project board. Status: LIVE stpierre-command-center.pages.dev, also RENDERED EMPTY (identical to Project Check). Verdict: DEPRECATE.

Empty project board (mirror)
shots/projects-deployed-s01.png
Projects deployed empty
What we see right now0 / 0 / 0 / 0, "as of Jul 19, 4:31 AM" — pixel-for-pixel the same as Project Check. Same RLS lockout, just served from Cloudflare Pages.
What to look forA public deployment of a broken, empty board is worse than none — anyone handed the URL sees zero. Retire it; if a public project board is wanted later, deploy the v_dash-fixed version once.
Infra Backlog RECLASSIFY LOCAL 6-week build plan, not a dashboard

What it is: the 6-week infrastructure build plan ("Autonomous Agency OS — Infrastructure Sprint Backlog"), sprint window Jul 20 → Aug 30. Status: LOCAL, prepared 2026-07-18, static document. Verdict: RECLASSIFY → docs/library.

Seven layers + six-week stories
shots/infra-backlog-s01.png
Infra backlog s01
shots/infra-backlog-s02.png
Infra backlog s02
shots/infra-backlog-s03.png
Infra backlog s03
How to read it§1 rates the 7 infrastructure layers (L1 Data spine 80% … L7 Platform/governance 70%, averaging ~60%). §2 is the story backlog W1-1 → W6-6 with acceptance criteria. Addendum A adds 6 Cash OS stories. §3 lists what's excluded.
What we see right nowWorth surfacing elsewhere: L4 Department agents only 40% (definitions, not running runbooks) and L2 Measurement 50% ("the loop's biggest hole") are the weakest layers; 461 tasks have no project; a +43GB git-storage cleanup is pending. Useful content, but it belongs in the build plan, not the dashboard list.
What to look forThis is where the "Infrastructure completion %" department KPI should be sourced — but today it's hand-typed prose. To make it a real tracked metric, the layer %s and story states need to live in a table, not this HTML.
Builder Onboarding RECLASSIFY LOCAL onboarding doc, not a dashboard

What it is: the onboarding pack for the builder — the two-pipeline model, delegation rule, per-lane leading/lagging metrics, locked format contracts, daily rhythm, hard lines. Status: LOCAL, prepared 2026-07-18, static document. Verdict: RECLASSIFY → docs/library.

Operating model + pipeline metric map
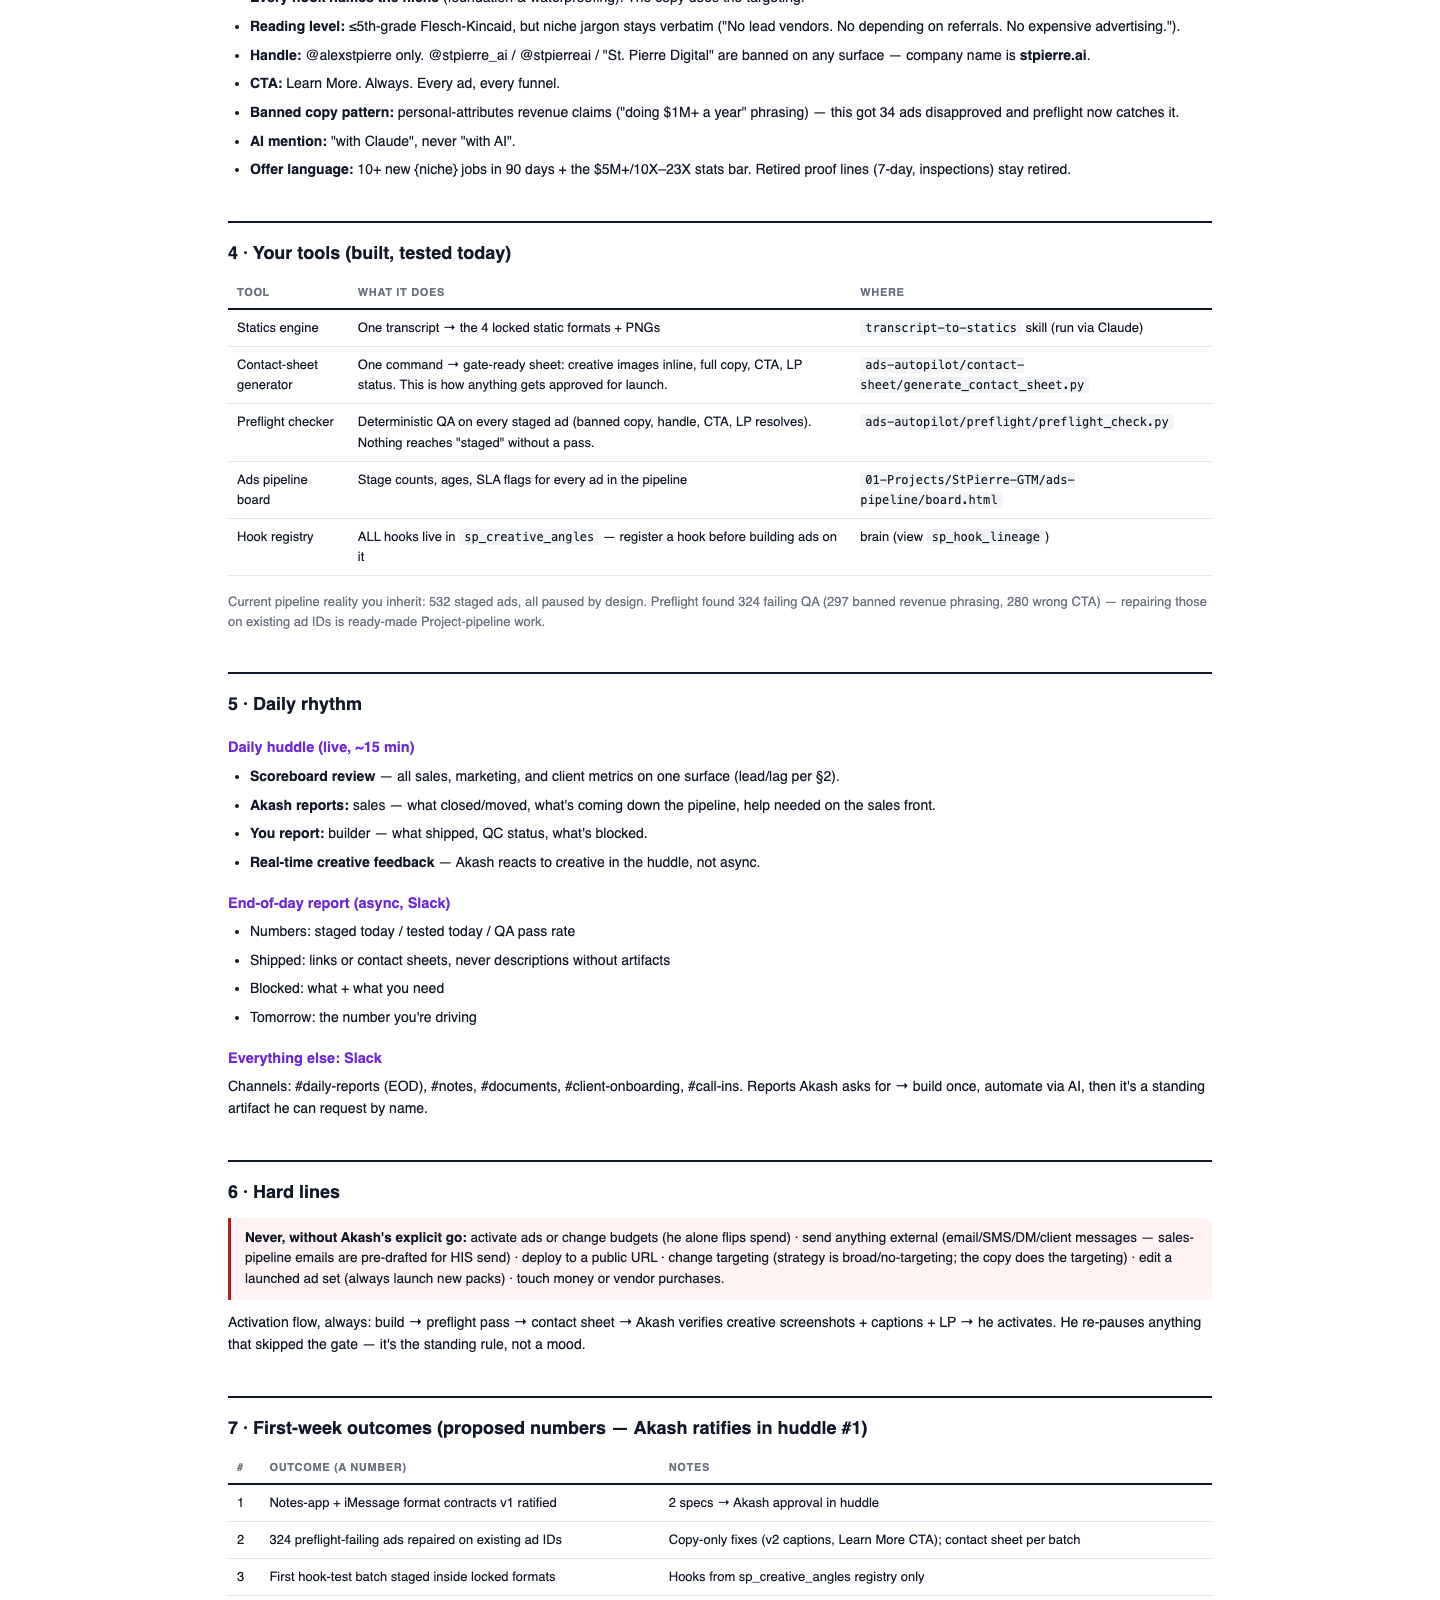
shots/builder-onboarding-s01.png
Builder onboarding s01
shots/builder-onboarding-s02.png
Builder onboarding s02
How to read it§1 defines People pipeline (Akash) vs Project pipeline (builder). §2 maps every lane to a leading + lagging metric and names the heroes. §4 lists built tools; §6 the hard lines.
What we see right nowConfirms this room's framing — "Marketing's hero: CPQL. The revenue side's hero: RPL." States the delegation rule ("Akash delegates outcomes expressible as numbers"). §4 notes the pipeline reality the builder inherits: 532 staged ads, 324 failing QA (297 banned revenue phrasing, 280 wrong CTA) — copy-only fixes on existing ad IDs.
What to look forNothing to "monitor" — it's the rulebook. Value is as a linked reference from the cockpit, not a standalone dashboard tile.
Execution Pack RECLASSIFY LOCAL a dated one-off rollup

What it is: a dated one-off rollup ("Execution Pack — July 18") of everything staged without touching a client or spending a dollar, with four items awaiting Akash's yes. Status: LOCAL, dated Jul 18, static one-off (stale by design tomorrow). Verdict: RECLASSIFY → docs/library (archive dated rollups).

What got executed + approvals
shots/execution-pack-s01.png
Execution pack s01
shots/execution-pack-s02.png
Execution pack s02
How to read itA summary table (item / status / what happened), then per-item detail, ending in a red "Left untouched — these are yours" block of Akash-only actions.
What we see right nowFour items — G2 SMS copy bank v2 (DRAFT READY), kill-criteria pre-commitment (DRAFT READY), G1 warm-ladder readiness (VERIFIED), cold-canary restructure (PROPOSAL). Kill-criteria are concrete: warm ladder $20/day (kill if spend ≥ $280 with zero calls, or cash < $1,500); cold canary $50/day (kill if spend ≥ $600 with zero Typeform submits); global $1,000 spend with zero calls → full review. All Meta reads were against act_1096498922089551.
What to look forA snapshot of one day's decisions — its value expires. Green flag = the four "awaiting your yes" items get resolved and don't roll forward unactioned. It should live in an archive, not be mistaken for a live board.

Confusing bits to fix (the wife test)

  • The zero-project boards read as "the business is empty" — 0/0/0/0 with no error message. Needs a visible "data unavailable" state, or just fix the RLS.
  • Acronyms with no legend — DoD, ICE, CPQL, RPL, SLA, QA, BOF, L0/L1…L7 layers, v_dash, RLS, DND/STOP.
  • "Baked fa-1.2.0" / "finance room · baked" means nothing to a newcomer — label it "as-of snapshot."
  • The money hero shows a scary state without context — "20 days," "$376 below floor," "hot." Add a one-line caption ("cash is tight; runway is the number to watch").
  • Income next 30 days = "--" looks broken, not "not modeled yet." Say which it is.
  • The broken "This week" embed shows a broken-image icon — fix or remove.
  • Habits grid all grey with "0 / 240" reads as "failed everything" — it means "nothing logged." Style the empty state differently.
  • Three documents sit in the dashboard list — move them to a clearly-labeled docs/library shelf.

9 · 🔁 Loop Engine / OS

The room in plain English

This is the room where the week runs as a loop: pick the bars (project), do the work (execute), grade yourself against the bars (reflect), and adjust (learn). Everything else is a department; this room is the machine that keeps them honest week over week.

It has six surfaces that split into three jobs. Two are the target machine (target-lock drafts next week's bars; review-panel reads this week's actuals). Two are top-of-house goal views (hq and north-star). Two are reflection views (accomplishments and disciplines).

The problem is sprawl and double-counting. review-panel and target-lock are two halves of one system. hq and north-star both want to be "top of house," and hq is empty. The room can collapse to three live dashboards plus one weekly report without losing a single question.

Room KPI recommendation

Core company KPI this room feeds: Runway (indirect) — this room keeps execution on the bars that produce cash. Its truest north-star is the Rolling Weekly Hit-Rate.

  • 1. Rolling weekly hit-ratetracked. Share of locked target bars hit this week. Reading 33% now.
  • 2. Ritual adherence ratepartial. The run log isn't capturing rituals being done, so the number is understated (reading 0%).
  • 3. Weekly throughputtracked. To-dos finished per week. 611 to-dos across 714 sessions in 6 weeks (~100/week, ~163 hours).

Consolidation verdict

DashboardVerdictWhy
Review PanelKEEPRoom anchor: this-week actuals vs bars, the off-track list, and the agent ledger in one place.
Target LockCONSOLIDATEReview-panel's other half; a dated single-week artifact. Fold into its Weekly Report tab.
HQDEPRECATE100% empty via RPC, EyeFly-branded; duplicates cockpit + north-star. Nothing uniquely owned.
North Star 2026KEEPAnnual goals with RAG pacing — make it the single top-of-house surface (so hq can die). Needs goal rows.
AccomplishmentsKEEPThe reflection half of the loop. Unique, rich, real data.
DisciplinesKEEPThe "did I run the loop?" meta-check. Fix its logging, not its concept.
Redundancy found: review-panel and target-lock are one system shown twice (both read the 6-lane sp_department_* loop). hq and north-star overlap as top-of-house views, and hq additionally duplicates the Projects-room cockpit. Separately: this room's sp_department_* target machine is a different target system from the scorecard room's 25-metric scorecard_weekly — two parallel target/actual systems that should reconcile to one.
Review Panel KEEP LIVE the weekly operating cockpit

What it is: every department's target bar, this week's actual, the hit-rate, the off-track list you can comment on, and a live ledger of what the agents did. Status: LIVE team.stpierre.ai/ops/review-panel/ (6 depts · 60 targets · 135 ledger rows). Ledger fresh to 7/18 11:56. BUT the header reads "current week Jul 6 – Jul 12" — read Jul 19 that label is a full week stale. When to open: every morning (Morning Brief); once a week (Weekly Report) to lock next week. Hero check: No — point-in-time tiles. Should trend rolling hit-rate + off-track count. Verdict: KEEP — room anchor.

Header + KPI tiles + lead actions + off-track + department pulse
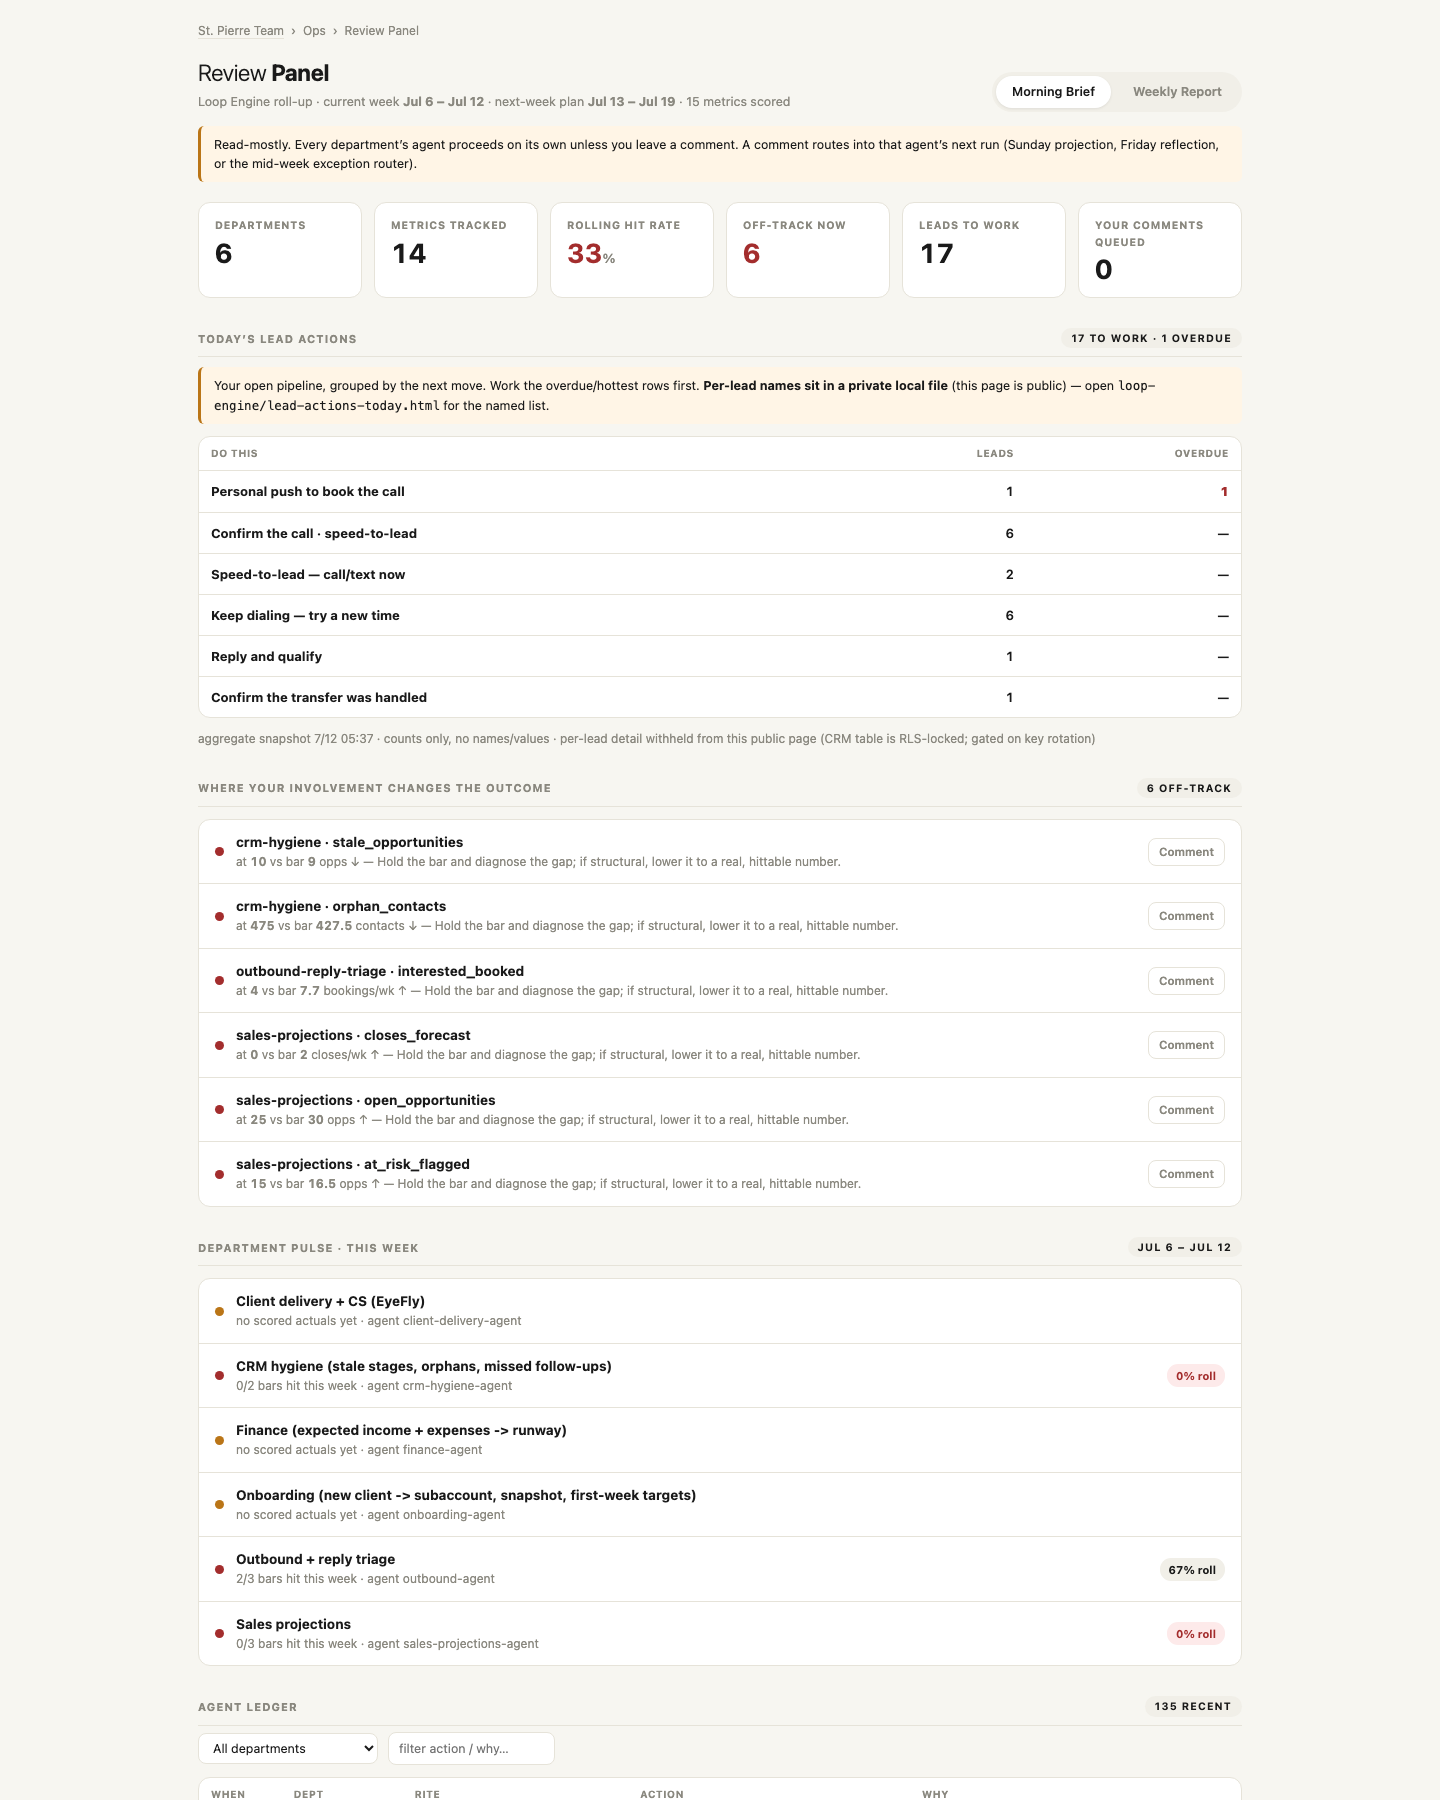
shots/review-panel-s01.png — tiles, lead actions, off-track, department pulse
Review panel top
How to read itSix tiles summarize the week (Departments, Metrics tracked, Rolling hit-rate, Off-track now, Leads to work, Comments queued). Below: today's lead actions grouped by next move (counts only — names withheld, this page is public); the off-track metrics where a human can move the number (with Comment buttons that route into an agent's next run); and a department pulse ("N/M bars hit").
What we see right nowRolling hit-rate 33% (red), off-track 6 (red), 17 leads to work, 0 comments queued, 6 departments, 14 metrics tracked (the header also says "15 scored" and the footer "60 targets" — three counts on one page). Lead actions: 17 to work, 1 overdue ("Personal push to book the call"). Off-track 6: crm-hygiene stale_opportunities 10 vs 9, orphan_contacts 475 vs 427.5, outbound interested_booked 4 vs 7.7, sales closes_forecast 0 vs 2, open_opportunities 25 vs 30, at_risk_flagged 15 vs 16.5. Department pulse: Outbound 2/3 (67%) is the only lane pulling weight; CRM hygiene 0/2 and Sales projections 0/3 are 0%; Client delivery, Finance, Onboarding all "no scored actuals yet."
What to look forGreen = hit-rate ≥75% (lets next week's bars stretch +10%). Red = hit-rate under ~50% or off-track ≥5 → open the off-track list and comment. 0 comments queued at 33% hit-rate means you looked but didn't intervene. closes_forecast 0 vs 2 is the money row. Three of six lanes unmeasured is the real story — the 33% is computed off only the reporting lanes.
Agent ledger
shots/review-panel-s02.png — agent ledger
Review panel ledger s02
shots/review-panel-s03.png
Review panel ledger s03
shots/review-panel-s04.png
Review panel ledger s04
shots/review-panel-s05.png
Review panel ledger s05
shots/review-panel-s06.png
Review panel ledger s06
How to read it135 recent agent actions, filterable by department and action type. Columns: when, dept, rite (Sunday Projections / Exception Router / Friday Reflection / Nightly Actuals / Manual), what it did, and why.
What we see right nowFresh to 7/18 11:56. Recent entries show the Jul-18 operating-focus cleanup landing: lanes content-strategy and repurposing set active=false and metrics parked; Collins-owned onboarding steps re-tagged to agent/Akash (Collins fired 2026-07-18); a marketing-ops preflight recorded 532 verdicts (208 pass / 324 fail); the Sunday-projections rite drafted next-week targets at "rolling hit rate=23%." Earlier Exception-Router rows show metrics "off pace (0 vs expected)" routed to the morning brief as P1.
What to look forGreen flag = Nightly Actuals and Sunday Projections firing on schedule. Red flag = a burst of Exception-Router "0 vs expected" rows (a lane's data feed is dead, not that the work stopped) — cross-check the source table before treating it as a performance miss.
Weekly Target Lock CONSOLIDATE LOCAL draft of next week's bars

What it is: the draft of next week's bars for all active lanes, so you can approve them with one reply. Status: LOCAL loop-engine-lock-2026-07-20.html, for week Jul 20–26, drafted Jul 18. All 14 rows status=draft. When to open: once a week, Sun/Mon. Hero check: No, and doesn't need one — a decision surface, not a monitor. Verdict: CONSOLIDATE → review-panel's Weekly Report tab; a dated report.

Objective bar + lane tables
shots/target-lock-s01.png
Target lock
How to read itTop strip states the objective (lock all 6 active lanes in one reply), why (no locked bar = no reflection/learnings), and scope (content-strategy + repurposing parked). Then one table per lane: metric, proposed bar, confidence %, reasoning. Each bar = trailing-week actual, stretched +10% when rolling hit-rate ≥75%, else held.
What we see right now14 draft targets across 6 lanes. Notable: Finance runway_weeks 26 (up from a trailing 13.5, note "income-off runway = business cash $2,896 ÷ opex $214/wk"), Finance income_variance_pct -100 (cash collected $0/wk vs projected $7,983/wk), Sales closes_forecast 2 (trailing 0, 40% confidence), Outbound outbound_sends 100 (trailing 0, 40% confidence). Low-confidence starters (30–40%) are the ones with no live source.
What to look forConfidence under 50% = a guess, not a measured stretch — those are the numbers to override in your reply. income_variance_pct of -100 (collected $0 against a projection) is the honest-red flag: the projection machine runs but no cash is landing.
St. Pierre HQ DEPRECATE BROKEN mission-control board, 100% empty

What it is: a mission-control board meant to show the WIG (Wildly Important Goal), objectives, ICE-ranked projects, P0/P1 tasks, and latest handoff. Status: LIVE stpierre-hq.pages.dev, source brain.get_mission_control(). Completely empty. Verdict: DEPRECATE.

Full page (all empty)
shots/hq-s01.png
HQ empty
What we see right now"WIG NOT FOUND," "NO OBJECTIVES," "NO P0/P1 TASKS," "NO RECENT HANDOFF," "NO PROJECTS," "0 TOTAL." Footer still reads EYEFLY-HQ-DASHBOARD and "St. Pierre HQ · H2-2026."
What to look forAlmost certainly a data-plumbing failure, not an empty business — suspect the RLS lockout. The accomplishments board proves the brain holds 611 finished to-dos and 714 sessions; an RPC returning nothing across every section is the signature of the publishable key being locked out. Because its content also duplicates cockpit + north-star, the fix is to retire it, not re-plumb it.
North Star 2026 KEEP LIVE annual goals, RAG pacing

What it is: annual goals with RAG (red/amber/green) pacing and progress — the top-of-house scoreboard. Status: LIVE stpierre-north-star.pages.dev, "live from the brain on every load." Renders "No structured goals." Hero check: No — should open with goal-progress % over time (RAG-banded) per goal, but there are no goal rows yet. Verdict: KEEP — make it the single objectives surface (absorb hq's dead band).

Empty state
shots/north-star-s01.png
North star empty
How to read itThe on-page note explains the blank: your life goals from the root doc (25 clients, brand, honeymoon, family) aren't structured goal rows yet, and the goals table filters out junk "Unassigned/Standalone" rows.
What we see right nowZero goals. Per the page's own note this is a genuinely unpopulated table, not the RLS lockout — the page connects fine (it renders the note live); the goals just haven't been entered.
What to look forFixed by data entry, not by unblocking a key. Add the four+ life goals as structured rows with a target and a current value, and the RAG pacing populates.
Accomplishments (What Got Done) KEEP LIVE the reflection half of the loop

What it is: a retrospective of finished work across six lanes, with 6-day / 6-week / 6-month windows. Status: LIVE stpierre-accomplishments.pages.dev, "always current," rich with real data. When to open: weekly (Friday reflection / Sunday) and at sprint review. Hero check: No — should open with to-dos-finished-per-week; the per-week counts are already computed, so the line is fully drawable today. Verdict: KEEP.

Summary + lane grid + balance check
shots/accomplishments-s01.png
Accomplishments
How to read itHeadline states the window's totals. Tiles give work sessions, to-dos finished, busiest/quietest lane, and an hands-on-time estimate. The grid shows each lane (Brand, Funnel, Sales, Ops, Product, Library) week by week. The Balance Check bars show where effort went as a share of hours.
What we see right now (6-week view)611 to-dos across 714 sessions, ~163.2h hands-on (clock data on 134 of 714 sessions, scaled up). Ops busiest, Sales quietest. Balance check: Ops ~70.8h (43%), Brand ~55.4h (34%), Library ~17.4h (11%), Funnel ~13h (8%), Product ~3.5h (2%), Sales ~3.1h (2%). Sales is the red bar.
What to look forGreen = effort roughly matches priorities. Red flag = the mismatch here — under the Jul-18 "only ads/funnels/sales/fulfillment/cashflow" focus, Sales + Funnel getting a combined ~10% of hours while Ops+Brand take 77% is off-strategy. The "no summary yet" cells mean weekly summaries aren't being written.
Disciplines & Self-Grade KEEP LIVE "did I run the loop?"

What it is: ritual adherence pulled from your actual run log — did you run each daily/weekly/sprint ritual, with a letter self-grade. Status: LIVE stpierre-disciplines.pages.dev, source ritual_runs. Hero check: No — should open with ritual-adherence % per day (7-day), but the log currently records zeros. Verdict: KEEP (fix logging, not concept).

Grade + ritual rows
shots/disciplines-s01.png
Disciplines
How to read itA big letter grade summarizes recent adherence. Then two lists — Daily Rituals (sync, review, deepwork-prep, huddle, shutdown) and Weekly+Sprint cadence — each showing "N in 7d · N in 30d" and last-fired.
What we see right nowGrade F — "0 of 5 daily rituals fired in the last 2 days (0%)." Every ritual reads 0 in 7d · 0 in 30d · never, including daily-shutdown.
What to look forThis is a logging gap, not a behavior gap. The header says "shutdown is the only consistent one," yet the table shows daily-shutdown = never — an internal contradiction. The footer confirms the split: planning rituals log to ritual_runs, while the 5 physical disciplines track in routine_completions, "which is still empty." So the F measures an empty log, not zero discipline — wire the runs before trusting the grade.

Confusing bits to fix (the wife test)

  • WIG (hq) — Wildly Important Goal. Define on the page.
  • RAG pacing (north-star) = Red/Amber/Green. Not defined anywhere.
  • Rolling hit-rate (review-panel) — the share of this week's target bars you hit; ≥75% lets next week stretch +10%.
  • "bar" means "the target number" everywhere — say "target (the bar)" on first use.
  • ICE-ranked (hq) = Impact / Confidence / Ease. Unexplained.
  • speed-to-lead (lead actions) = call/text a new lead within minutes.
  • The rite names (Sunday Projections, Exception Router, Friday Reflection, Nightly Actuals) are jargon — add a legend mapping each to project/execute/reflect.
  • Empty ≠ broken, and the two empties differ: hq (blank via RPC) reads like the RLS lockout (plumbing); north-star ("No structured goals") is genuinely unpopulated (data entry). Each empty state should say which it is.
  • Stale/contradictory labels: review-panel's header says "current week Jul 6 – Jul 12" (a week stale) and shows three metric counts (15 / 14 / 60). disciplines grades F off an admittedly-empty log.
  • Banned company name on two boards: accomplishments subtitle "St. Pierre Digital" and hq footer "EyeFly-HQ-Dashboard." Replace with stpierre.ai.
  • "~" times (accomplishments) are estimates scaled from partial clock data (134 of 714 sessions) — legend the tilde near the big 163.2h number.

10 · Fix List

Every defect found across the audit, worst-first. P0 = data plumbing that makes hero metrics impossible · P1 = broken/misleading surfaces · P2 = naming, staleness, registry · P3 = cosmetics and plain-English legends. "Owner" = who has to act: Mechanical a builder can just do; Akash needs your decision.

SevWhat's brokenWhereRecommended fixOwner
P0No history for cash/runway or any KPI — line-graph heroes are impossible. finance_metric_snapshots holds 1 row.All rooms (hero graphs)Wire a nightly KPI snapshot job that appends every core + dept KPI to scorecard_values / finance_metric_snapshots (append, never overwrite). The 06:15 chain already runs.Mechanical
P0Project boards render 0 — publishable key queries the raw projects table (RLS lockout), returns zero rows.project-check, projects-deployedExpose a curated SELECT-only v_dash view and point the board at it (never open anon policies on the base table).Mechanical
P0HQ 100% empty — get_mission_control() RPC returns nothing across every section (RLS lockout signature).hqVerdict is DEPRECATE (content duplicates cockpit + north-star), so retire rather than re-plumb.Akash
P0Silent collector bugs — sur (show-up rate) and close-rate have a source query but land zero rows (fake zeros).scorecard, sales command center✓ Done (Jul-22): two Sales filter fixes (test-flag leak + booking clean-run window) made both collectors return real rows — show rate 100% (n=1), close rate a real 0% off 1 booking, not a fake zero. Scorecard side still to verify.Mechanical
P0Guarantee-pace hero is dark — monthly_lead_target is NULL for 40/40 clients; the board never joins leads delivered.delivery-boardEnter each client's monthly lead target (Akash), then wire the pace = delivered ÷ target join (Mechanical).Akash + Mechanical
P0CPQL / RPL — the two named room heroes — are computed on no surface (spend and leads exist but are never joined + filtered to "qualified").marketing, salesAgree a "qualified lead" definition (Akash), then build the join (Mechanical).Akash + Mechanical
P0Leads denominator undecided — 52 Typeform apps vs 127 funnel events vs 1 real contact. Blocks RPL entirely.sales command center (open Q4)Pick the canonical leads denominator.Akash
P0Five of the 12-core items are untracked: live ads, leads, inspections delivered (nowhere), expenses (point-in-time only), churn / net-new MRR (empty).scorecard / 12-core mappingWire feeds: live ads from sp_ad_metrics_daily, leads from sp_funnel_events, build an inspections-delivered feed, add expense + churn/net-new-MRR collectors.Mechanical
P1THREE parallel target/actual systems: scorecard_weekly (25), loop sp_department_* (6 lanes), sales.html's own 24-metric contract. "Close rate" means three things.cross-roomCollapse to one target system so a metric name is defined once company-wide.Akash
P1Dead URL — eyefly-personal-finance-dashboard.pages.dev returns DNS_PROBE_FINISHED_NXDOMAIN.personal-financeDelist from the hub (Cash-OS merge already folded personal cash into the finance room).Mechanical
P1Dead URL — eyefly-sp-install-sop.pages.dev DNS-fails; also EyeFly-branded.install-sopRemove from the registry; rehost as a doc on a stpierre.ai surface if the content is still wanted.Mechanical
P1Broken "THIS WEEK" iframe — embed to the W30 plan shows a broken-image icon on the hero page.cockpitPoint the embed at the live W30 plan file, or drop the panel.Mechanical
P1Wrong "$0 / Zero ads serving" tile while the cockpits show $123.07 spend, 111 live ads, 1 lead. The tile isn't reading live data.marketing-room hubWire Live Spend to the same source Ads Autopilot uses.Mechanical
P1Published-workflow risk = 3 — three live external-send surfaces flagged RISK (mis-branded FB "concrete" workflow + 2 Slack actions) could fire sends behind the room's back.sales command centerProve each of the 3 unpublished (or disable them) to clear the flag.Akash + Mechanical
P1Data hygiene — knoxville-tn-cs carries a churn date of 2026-04-15 (3 months ago) yet still counts as an active client.delivery-boardReconcile: remove from the active 40 if churned, or clear the stale date.Akash + Mechanical
P1GREEN health pills on AT-RISK rows — Health and Retention are two scores that contradict, with no on-page explanation of which wins.delivery-boardExplain what each column measures; decide which drives the "act on this client" signal.Mechanical
P1Scorecard owners are EyeFly-era (Sean, Jason, Jean, JM, Regina, Collins) — Collins was fired Jul-18.scorecard_metricsRe-assign metric owners to current St. Pierre roles; remove Collins.Akash
P2Banned company name "St. Pierre Digital" / "EyeFly" on 5 surfaces — creative-radar (via Meta page name), week1-runbook title, profit-first-pnl header, accomplishments footer, hq EyeFly branding.5 boardsReplace with stpierre.ai on every surface; fix the Meta page name at its source (feeds creative-radar).Mechanical
P2Stale renders with no loud warning — consolidated-pnl (Jun-22 snapshot, 27d), review-panel (header week Jul 6–12), weekly-scorecard.html (rendered Jul-11), cockpit money hero (baked Jul-17/18).4 boards✓ Partly done (Jul-22): finance, cockpit, and sales now re-bake daily at 6:45am (launchd com.stpierre.finance-room-render). Still open: consolidated-pnl / review-panel / weekly-scorecard scheduling + the loud "STALE — last updated N days ago" banner past the refresh window.Mechanical
P2brain.dashboards registry table is referenced in docs but does not exist (only v_dash_* views).docs / hub footerEither create the registry table or correct the docs to stop referencing it.Mechanical
P2weekly-scorecard.html (the live 25-metric board) is missing from the dashboards hub, while the hub's scorecard card points at the older Cash OS company-scorecard file.dashboards hubAdd weekly-scorecard.html to the hub; repoint or relabel the Cash OS card.Mechanical
P2All 25 scorecard targets are unratified (target_is_guess=true); only 6 have real target rules.scorecard_metricsRatify the targets so red/amber/green bands mean something.Akash
P2Two cash framings disagree and aren't labeled — business-only $2,826 / ~20 days vs combined −$198.85 / 0 weeks (and "business-only = 106 days" on the same tile).finance-room, company-scorecard, cockpitPick one canonical framing as "the number"; label the other side-by-side.Akash
P3Acronyms undefined on every board — MRR, CPQL, RPL, CPQBC, CAC, LTGP, RLS, WIG, DoD, ICE, RAG, VSL, GHL, DND/STOP, opex, etc.all roomsAdd a one-line glossary or first-use tooltip per surface (Start Here section here already lists them).Mechanical
P3UNKNOWN striped grey cards look broken.finance-room, salesAdd a legend: "Grey = no data source yet. We show UNKNOWN instead of a fake $0."Mechanical
P3State-tag badges (DRAFT / LOCKED / PROXY / UNSOURCED / UNKNOWN) have no legend.sales command centerAdd a five-item badge legend at the top of the scoreboard.Mechanical
P3Format suffixes (Postit, Napkin, Lock, iMessage, Safari, X) and niche codes (CS / CL / CF / FR) unexplained.ads-autopilot, delivery-boardAdd a one-line legend for each set.Mechanical
P3Empty states read as failure — habits grid "0/240" all grey, "9.9d" red counts, attribution timeline opens blank, "no update drafted" on 40 rows.cockpit, ads-pipeline, attribution, delivery-boardStyle empty/parked states distinctly from real misses; move the "expected while parked" note next to the scary count; add a default hint on the timeline.Mechanical
P3review-panel shows three different metric counts on one page (15 scored / 14 tracked / 60 targets).review-panelReconcile to one count and one label.Mechanical
P3Sunday brief hero reads "$49 draft weighted value" (5% DRAFT × $975) without a loud "not a forecast" label.sunday-sales-briefLabel weighted/draft estimates as "unproven estimate — not a forecast."Mechanical

Reminder: nothing above has been changed. This Fix List is the recommended backlog — approve the rows you want, in the order you want, and the Mechanical ones can be executed without further decisions.

St. Pierre Dashboard Field Guide · audit 2026-07-19 · recommendations only, no live surface was modified · source: room analyses + KPI synthesis in dashboard-guide/analysis/.